Sed diam nonummy nibh euismod tincidunt
Ut laoreet dolore magna aliquam erat volutpat. Ut wisi enim ad minim veniam, quis nostrud exerci tation ullamcorper suscipit lobortis nisl ut aliquip ex ea commodo consequat. Duis autem vel eum iriure dolor in hendrerit in vulputate velit esse molestie consequat, vel illum dolore eu feugiat nulla facilisis at vero eros et accumsan et iusto odio dignissim qui blandit praesent luptatum zzril delenit augue duis dolore te feugait nulla facilisi.
Don’t Go Through Pain Again – Real Stories of Streamlined ARO Management
Recently we have been talking a lot about the problem with spreadsheets and why you should consider a different tool for tracking and reporting asset retirement obligations (ARO). In this article, we share real world stories from a variety of professionals within the industry’s finance and operations teams. Our clients tell us regularly about how their workflow has improved since moving from a two-dimensional overly complicated spreadsheet into a relational, centralized database. We share three of our most interesting tales with you here.
The Day the Wizard Left
Our first story is about a client who was tracking their ARO in one of the most complex spreadsheets we had ever seen (and we’ve seen a lot!). By the time our team was called in to help bring order to the chaos, we realized how it got that way.
The company’s early ARO tracking started out as a very simple spreadsheet. This was a mid-sized producer with approximately 23,000 BOE (barrels of oil equivalent) per day and interest in over 7,200 oil and gas wells. They had kept up with their own ARO tracking as a matter of due process, relying on an internal Excel guru who appeared to have everything under control.
Then they made a sizeable acquisition.
And then they lost their spreadsheet wizard.
The wizard was the person who built the company’s original ARO spreadsheet and lovingly nurtured it to the point where it became a huge, complex, multi-coloured, formula-obscure spreadsheet. Naturally, the wizard took great pride in their spreadsheet. But the rest of the team was never in on all the complexities, so upon the wizard’s departure, this giant spreadsheet became a beast that no one wanted to tackle. The beast was tucked away in their IT closet while they desperately sought a new wizard.
Enter XI Technologies. With ARO Manager, the company was spared the angst of hiring a new spreadsheet unicorn. ARO Manager’s centralized database quickly became the solution that helped the company’s finance team regain control across several departments. In the process of onboarding, XI deployed our own implementation wizard who assisted with uploading all the existing well files, along with the newly acquired well list, and swiftly pulled together several key reports.
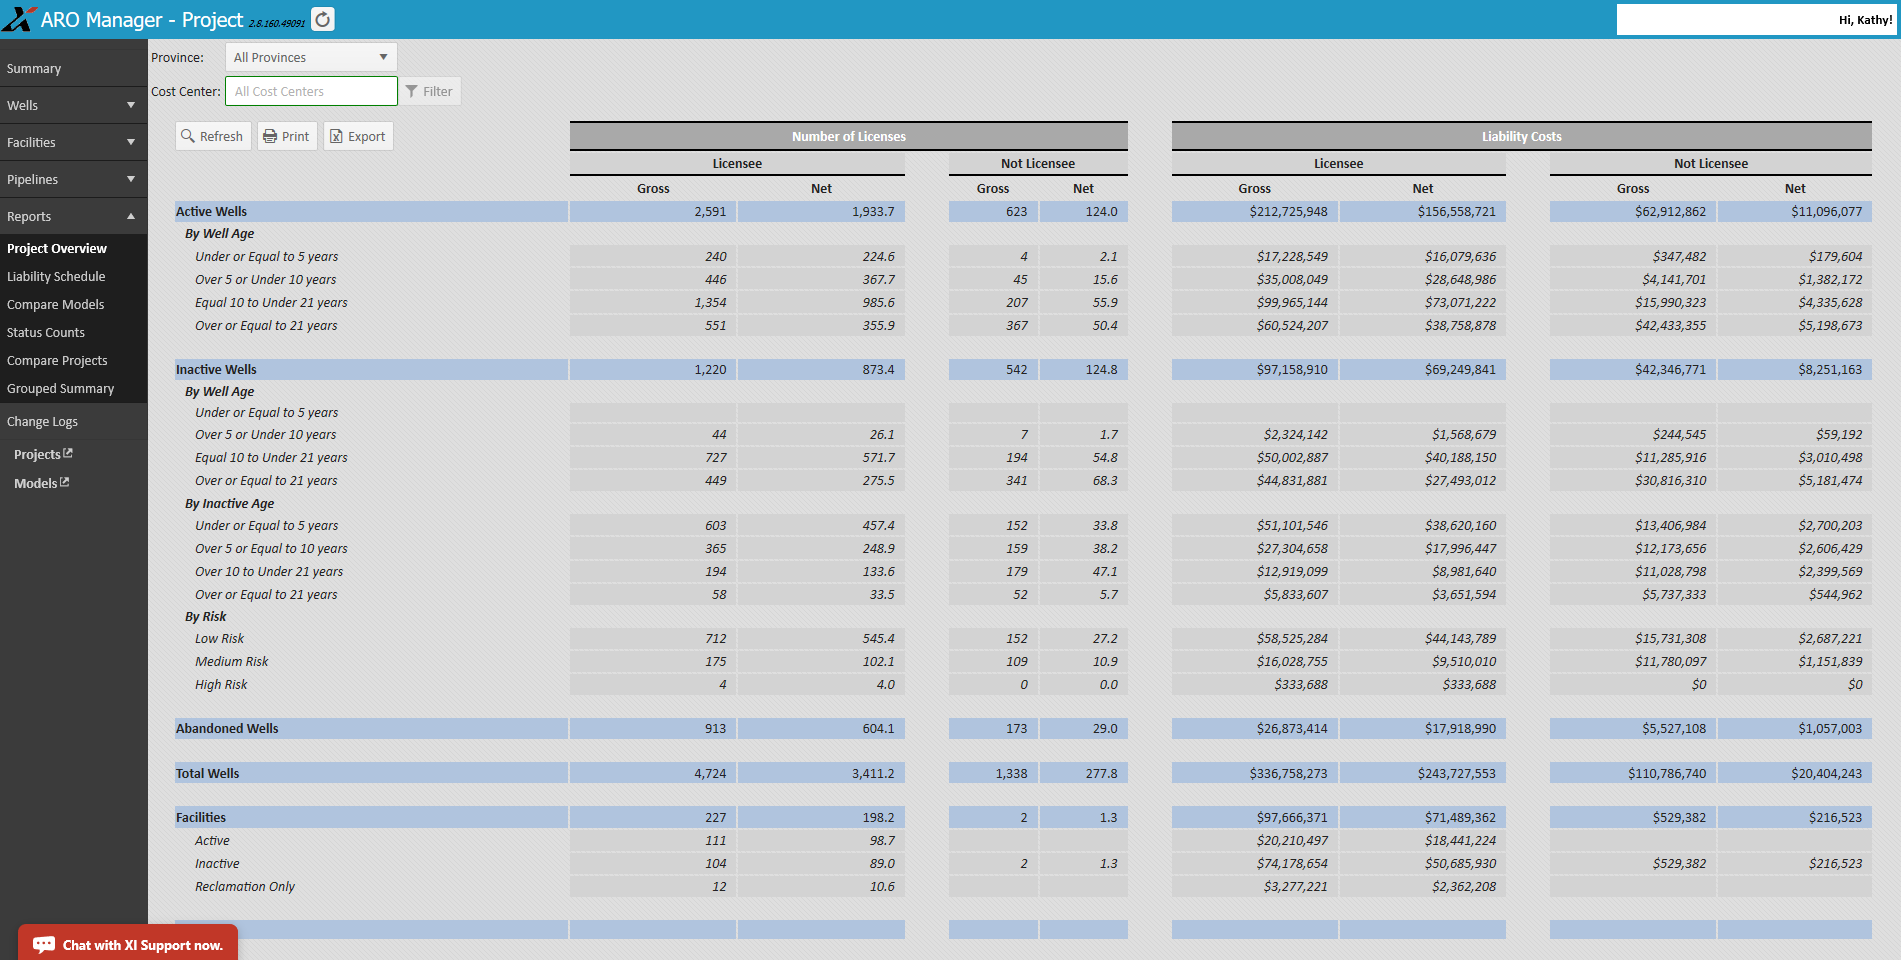
The CFO looked at the Group Summary Report and gave an audible sigh of relief.
This story has a happy ending. The company is now able to accomplish three things with mere clicks of a few buttons:
- Evaluate new acquisition opportunities with an eye on liabilities.
- Update company liabilities (with new well lists, changed cost models, revised discounts) to equip the leadership team with speedy analysis for ARO decisions.
- Submit reports to banks or auditors with the assurance of SOC compliance.

The Day the Company was Sold
This story’s hero knew the importance of positioning. He came to us with what seemed like a simple ask: help me position my company for sale. He was the president of a junior oil and gas company who was ready to retire.
In a time where a company’s value is based on intense scrutiny of both liabilities and production potential, the ability to be competitive in the mergers and acquisition space depends upon transparency across the board. Our hero knew how important it was to ensure they created a highly transparent view of their liabilities for a potential buyer’s apples-to-apples comparisons. They knew their value, but they wanted to make sure nothing held them back from making a swift deal in today’s market.
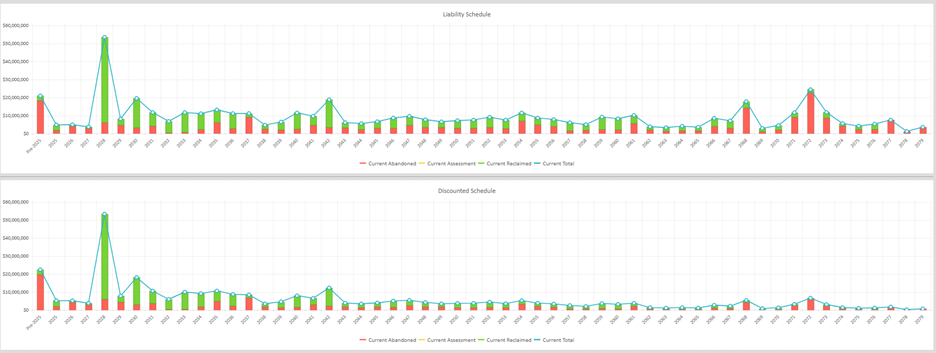
Once their wells were entered into ARO Manager, they were able to produce their Liability Schedule, a Discount Schedule, bank packages, internal summaries, and stakeholder snapshots that were widely accepted by all involved.
Their happy story was a successful sale. As for XI, we also celebrated with the easy move of data into a new company that used ARO Manager to integrate their new acquisition.

The Day the Auditor Beckoned
Our final story had a different opening scene. It started with the doomed “uh-ohhh” when the company – a producer with production of approximately 4,800 BOE per day and interests in 2,100 wells – was asked to resubmit their ARO reports to their auditors.
The spreadsheet machine went into overdrive to meet the due date. The small finance team worked overtime. The brows furrowed and sweat dripped down as everyone worked tirelessly to double- and triple-check every Excel input and formula.
The good news: they got the job done, despite their painful spreadsheet.
The bad news: it was the worst audit process they had ever been through.
The best news: they said, “never again” and turned to XI to get ARO Manager so that they would be prepared for the next round.
We are happy to report that this story’s final scene shows the shiny red “easy” button (yes, XI’s red is very similar to Staples), with the company’s finance lead pressing the button each quarter to quickly share their trustworthy SOC compliant report with the auditor.
Post-Story Reviews
The three stories above are about industry professionals who have made the switch from spreadsheets to ARO Manager, resulting in a profound positive impact to their ARO workflows. Here are some additional reviews from those who have also made the transition from spreadsheets:
- Senior Analyst: “Switching to AssetBook’s ARO Manager has been transformative. We no longer have to deal with the inefficiencies and errors that come with spreadsheets. The web-based platform gives us quick access to accurate data, streamlining our workflow and improving overall data accuracy.”
- Operations Manager: “Spreadsheets were prone to version control issues, which made it difficult to manage and access detailed working interest data. Having a centralized, web-based platform eliminates those problems and has improved our decision-making process significantly.”
- Decommissioning Coordinator: “Managing ARO obligations in spreadsheets was incredibly challenging, especially with the volume and complexity of the data. ARO Manager’s web-based platform makes it so much easier to track and update our ARO data, helping us stay compliant and plan decommissioning activities more efficiently.”
If you enjoyed these stories and would like to explore how your company can transition from the pain of spreadsheets to a streamlined database like ARO Manager, contact XI Technologies today.
We’re happy to help you create your own happy ending.
Upcoming Events / Trainings:
Getting the Most Out of Maps Information: Discover the available functions and workflows utilizing all aspects of the mapping tool, including:
- Searching using corners or polygons
- Layering sets of assets on the map
- Searching using mapped assets
- Workflow demonstrations to show assets on the map that meet set criteria
When: April 30th 1pm (Online)
Length: 30 minutes
Check out our new Training Classes & Events calendar page to get the most value from your XI products. More training classes added to the May, June, July Calendar. Would you like to save time by learning pro tips, short-cuts, and added functionality? Want to upgrade your skills and expertise?
Latest Webinars:
ARO Manager for Financial Tracking & Reporting
- Get a more complete picture of asset retirement costs.
- Cost management is a vital part of the business and operating strategy for every Canadian oil and gas producer. But if you are focused primarily on development and operations costs, then you are missing a significant part of the picture.
- AssetBook ARO Manager is the first and only software application specifically designed for estimating and monitoring asset retirement obligations (ARO) in the Western Canada oil and gas sector. For exploration and production companies, ARO Manager provides transparency and SOC-compliant assurance when monitoring and tracking liabilities for financial reporting.
H2S Reporting – Why Accuracy, Efficiency, and Compliance Matters
Struggling to meet H2S reporting requirements with limited resources or time? We’ve got you covered.
In our latest webinar, we provided valuable insights on:
- Regulatory rules and expectations, including revisions to Directive 056.
- How to ensure compliance, find efficiencies, save costs, and work as a team for consistent and transparent APEGA-approved reporting.
- Manage mergers, acquisitions and divestitures with ease (no duplication of reports).
- Learn about H2SComplete as a full solution to help you quickly manage and mitigate risks associated with hydrogen sulfide (H2S) safety.
XI Technologies has moved to our NEW LOCATION:
XI Technologies Inc.
2400 – 500 4th Avenue SW (Altius Centre)
Calgary, Alberta T2P 2V6
Curious to learn more about XI’s product suites? Book a product demo today!
The number of users for XI Technologies modules is not limited to individual seats. The modules are accessible on a corporate wide subscription. Your company may have a XI Technologies AssetBook subscription. To register for access to your corporate account, click here.
—
Each week, XI Technologies uncovers trends and insights using our enhanced data and software focused on the WCSB. If you’d like Word to the Wise delivered directly to your inbox, subscribe here. For more tips and to learn about how XI’s AssetSuite can help with your high-level analysis visit XI’s website or contact XI for a demo.
Did you go through pain managing your Asset Retirement Obligation (ARO) planning with spreadsheets?
If you’ve been using spreadsheets to track your AROs, you’re no stranger to the challenges they bring—whether it’s the constant fear of human errors, struggling with outdated formulas, or trying to collaborate across teams with version control issues. Sound familiar?
In the previous post, we talked about the growing challenges of managing ARO planning with spreadsheets. If you’re still in the trenches, this post is for you. We’re diving deeper into how relying on spreadsheets creates unnecessary pain, costs your organization time and resources, and ultimately undermines the efficiency of your ARO planning efforts.
The Pain You’re Probably Experiencing
If you’re still using spreadsheets for ARO planning, you’ve likely experienced more than your fair share of frustration. Here are a few examples of the pain you might be going through:
- Data Integrity Nightmares: Spreadsheets are prone to errors—simple ones like typos or more complex ones like broken formulas. These mistakes might not surface immediately, but they can lead to inaccurate ARO forecasts, potentially throwing off your entire planning process. Missing data or incorrect reports can leave your organization vulnerable to compliance risks and financial penalties.
- Slow and Cumbersome Processes: As your ARO data grows in complexity, spreadsheets slow down. Trying to update calculations, track new projects, and manage cost estimates in increasingly large files becomes an exercise in patience and persistence. Updating hundreds of licenses manually can take weeks and can exasperate the data integrity nightmares above.
- Version Control Chaos: Are you constantly dealing with different versions of the same spreadsheet, unsure of which one is the most up-to-date? When multiple team members are updating data in isolation, it’s easy to lose track of changes and create inconsistencies that impact your reports and forecasts. Regulatory compliance is a top priority when it comes to ARO, but spreadsheets lack the features needed to maintain an audit trail, track revisions, or ensure proper documentation.
- Painful Reporting: How many times have you struggled to collaborate on a spreadsheet, only to find that someone else made changes without updating the document or overwriting your work? Working on spreadsheets with cross-functional teams—whether finance, operations, or legal—leads to conflicts and inefficiencies, which drain your productivity.
The Relief You’re Looking For: A Better Way to Manage ARO
At XI, we hear this pain load and clear and have built tools to make this process easy, accurate and repeatable.
1. SOC Compliant Software with Data Integration
Our SOC Compliant software removes all your data integrity nightmares. We deal with all the behind the scene formulas so that you don’t have to. No more broken formulas, data gaps or errors with updates.
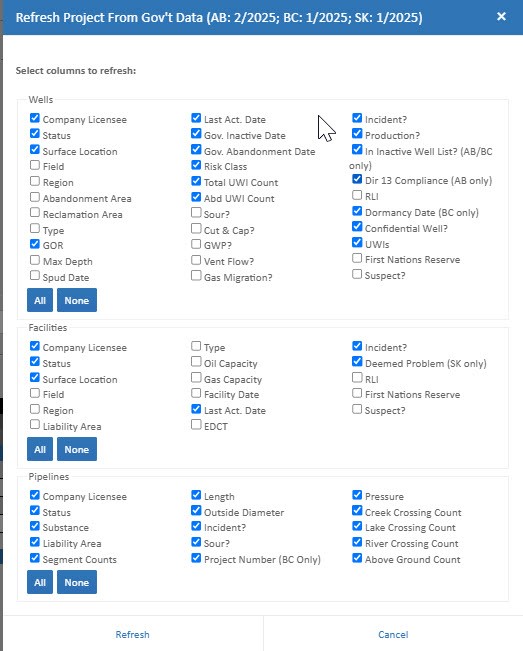
2. Connect Directly to Government Data
Our platform allows you to refresh your project data directly from government sources with a single click. You can instantly update relevant well, facility, and pipeline information—eliminating the hassle of manual entry and ensuring data integrity at all times.
3. Track Every User Change
Worried about version control or tracking decisions? Our system tracks all user changes so you always know who made what updates, when, and why keeping your audit trail clear and your team accountable.
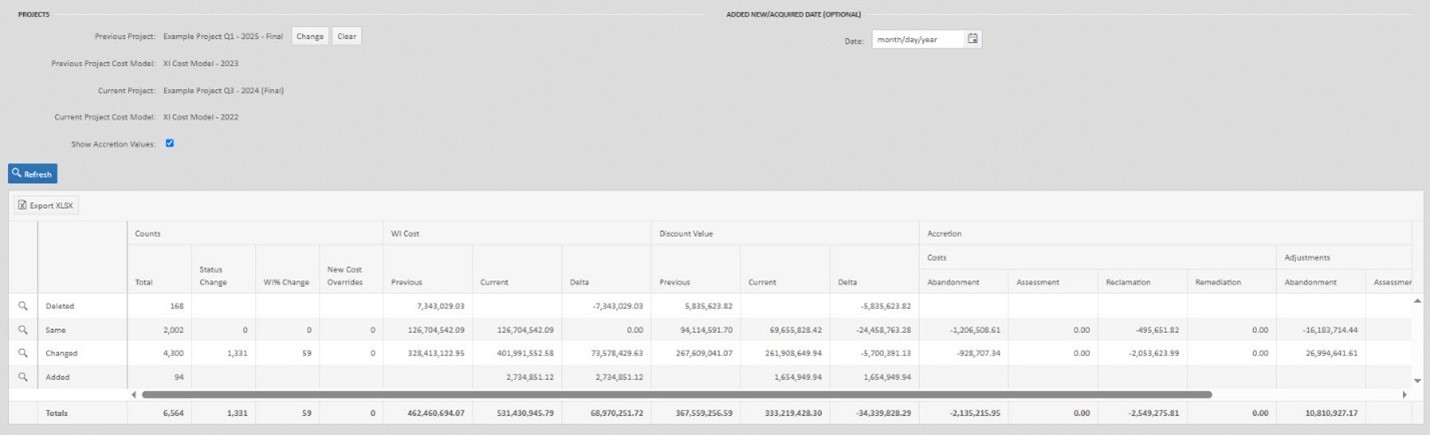
4. Pull a Full Change List with Accretion Values
Generate a complete change summary with work interest (WI) cost deltas, discount value adjustments, and accretion values for every record. This makes it simple to generate your Journal Entry support with zero confusion.
5. Click-and-Go Stakeholder and Bank Reporting
All your key reports—bank packages, internal summaries, stakeholder snapshots—are built right in. You can export what you need with a single click, saving hours and reducing the risk of error.
We’ve made it our mission to take the pain out of this process.
Ready to Say Goodbye to Spreadsheet Pain?
The pain of using spreadsheets to manage ARO planning is real. But it doesn’t have to be your reality. Specialized ARO management software is the key to eliminating those frustrations, ensuring accuracy, and enhancing collaboration. It’s time to move beyond spreadsheets and unlock the true potential of your ARO planning process.
In our next post, we’ll delve into real-life examples of companies that have made the switch from spreadsheets to specialized ARO management software—and the incredible results they’ve seen. You won’t want to miss it!
Have you experienced the pain of managing ARO with spreadsheets? Watch our recent ARO Manager Webinar from March 25th: Watch Now!
Upcoming Events / Trainings:
Follow the Molecule – AssetBook Production Chain: Learn how to run AssetBook’s latest feature – Production Chain.
When: April 24th at 1pm (Online)
Length: 30 minutes
Using LCA & LLR reports to your Advantage: Learn how to run an LCA and LLR report, and how these reports align with Directive 088 with regards to A&D Scoping.
When: April 29th at 9am (Online)
Length: 30 minutes
Getting the Most Out of Maps Information: Discover the available functions and workflows utilizing all aspects of the mapping tool, including:
- Searching using corners or polygons
- Layering sets of assets on the map
- Searching using mapped assets
- Workflow demonstrations to show assets on the map that meet set criteria
When: April 30th 1pm (Online)
Length: 30 minutes
Check out our new Training Classes & Events calendar page to get the most value from your XI products. Would you like to save time by learning pro tips, short-cuts, and added functionality? Want to upgrade your skills and expertise?
Latest Webinars:
ARO Manager for Financial Tracking & Reporting
- Get a more complete picture of asset retirement costs.
- Cost management is a vital part of the business and operating strategy for every Canadian oil and gas producer. But if you are focused primarily on development and operations costs, then you are missing a significant part of the picture.
- AssetBook ARO Manager is the first and only software application specifically designed for estimating and monitoring asset retirement obligations (ARO) in the Western Canada oil and gas sector. For exploration and production companies, ARO Manager provides transparency and SOC-compliant assurance when monitoring and tracking liabilities for financial reporting.
H2S Reporting – Why Accuracy, Efficiency, and Compliance Matters
Struggling to meet H2S reporting requirements with limited resources or time? We’ve got you covered.
In our latest webinar, we provided valuable insights on:
- Regulatory rules and expectations, including revisions to Directive 056.
- How to ensure compliance, find efficiencies, save costs, and work as a team for consistent and transparent APEGA-approved reporting.
- Manage mergers, acquisitions and divestitures with ease (no duplication of reports).
- Learn about H2SComplete as a full solution to help you quickly manage and mitigate risks associated with hydrogen sulfide (H2S) safety.
XI Technologies has moved to our NEW LOCATION:
XI Technologies Inc.
2400 – 500 4th Avenue SW (Altius Centre)
Calgary, Alberta T2P 2V6
Curious to learn more about XI’s product suites? Book a product demo today!
The number of users for XI Technologies modules is not limited to individual seats. The modules are accessible on a corporate wide subscription. Your company may have a XI Technologies AssetBook subscription. To register for access to your corporate account, click here.
—
Each week, XI Technologies uncovers trends and insights using our enhanced data and software focused on the WCSB. If you’d like Word to the Wise delivered directly to your inbox, subscribe here. For more tips and to learn about how XI’s AssetSuite can help with your high-level analysis visit XI’s website or contact XI for a demo.
Are you struggling to manage your Asset Retirement Obligation (ARO) planning with spreadsheets? If you’re like many exploration and production (E&P) companies, you’ve relied on spreadsheets for years as a quick and easy way to track your ARO data. But as the regulatory demands of the industry evolve, spreadsheets may be causing more harm than good, leading to inefficiencies, inaccuracies, and costly mistakes.
In this blog series, we’ll explore why relying on spreadsheets for ARO tracking and reporting is no longer a viable solution, how it can be undermining your operations, and what you can do to improve your ARO management process.
The Growing Challenges of ARO Management
ARO is a critical element of financial and operational planning, especially in the oil and gas sector where the costs of asset abandonment and reclamation can be substantial. As regulatory frameworks like Directive 011 from the Alberta Energy Regulator’s (AER) evolve, the complexity of ARO tracking and reporting increases, making traditional methods like spreadsheets inadequate.
But first, let’s define ARO. Asset Retirement Obligation (ARO) refers to the future costs associated with decommissioning assets, including wells, pipelines, and other infrastructure. These obligations need to be accurately predicted, tracked, and reported to comply with regulations and safeguard your company’s financial health.
Transitioning from spreadsheets to specialized ARO management software can significantly enhance accuracy, efficiency, and compliance. Purpose-built solutions, such as ARO Manager, offer standardized, web-based tools tailored to the unique needs of the oil and gas industry, providing comprehensive insights into end-of-life closure activities and obligations, facilitating better decision-making and risk management. By adopting such technologies, organizations can mitigate the challenges associated with traditional methods and ensure a more streamlined approach to ARO management.
Why Spreadsheets Just Don’t Cut It Anymore
Are you tired of dealing with broken formulas, data-entry errors, or the frustration of keeping track of multiple versions? Here are 5 reasons to move away from spreadsheets today:
- Human Error is Inevitable
Spreadsheets are often plagued by simple mistakes like typos, incorrect formulas, and miscalculations that can have a huge impact on ARO planning. These errors can go unnoticed until it’s too late, affecting your company’s compliance and costing you time and money to fix.
- Version Control Nightmares
How many times have you updated a spreadsheet, only to realize someone else was making changes to a different version? Version control is one of the biggest problems with spreadsheets. When multiple people are working on the same file, it’s easy for data to get lost or become inconsistent.
- Scaling Up Becomes a Hassle
As your ARO portfolio grows, managing more data in spreadsheets becomes a real challenge. Calculating and analyzing large volumes of data across multiple sites becomes cumbersome, slowing down your work and increasing the risk of errors. You might find that your spreadsheet performance starts to suffer as it becomes more bloated with information.
- Difficulties in Collaboration
Spreadsheets weren’t built for real-time collaboration. Whether it’s accidental overwrites, missing updates, or lack of transparency on who made what changes, collaborating on spreadsheets for ARO planning is far from efficient.
- Lack of Audit Trails and Compliance Features
In an industry where compliance is critical, spreadsheets fall short. They don’t offer the detailed audit trails needed to track changes and verify data. Missing documentation or inconsistent records can lead to non-compliance, resulting in fines or reputational damage.
The Consequences of Relying on Spreadsheets for ARO
When your ARO data isn’t accurate or up to date, it can have significant financial and operational consequences. Inaccurate ARO estimates can lead to missed liabilities or unpreparedness for future abandonment costs, ultimately affecting your company’s bottom line and compliance status.
Moreover, as regulations tighten and become more complex, spreadsheets simply cannot keep up with the sophistication required for accurate ARO tracking and reporting. This can leave your organization vulnerable to compliance issues, financial penalties, and potential damage to your reputation.
So, What’s the Solution?
It’s clear that the era of spreadsheets for ARO management is coming to an end. Companies need a more robust, scalable, and reliable solution to keep pace with the increasing complexity of ARO regulations and reporting.
XI Technologies developed AssetBook ARO Manager as the first and only software application specifically designed for estimating and monitoring asset retirement obligations (ARO) in the Western Canada oil and gas sector. For exploration and production companies, ARO Manager provides a centralized data source for collaboration, SOC-compliant transparency and assurance when monitoring and tracking liabilities for financial reporting. It significantly reduces the time required for complex ARO calculations.
ARO Manager, with its standardized cost model, was developed by experts in this industry, combining government data, C-suite experience, and professional input. It ensures you have your customized data integrated with accurate and up-to-date public information, benchmarked against real-world operator records. This streamlined approach eliminates the time-consuming hassle of manual data entry and reconciliation, allowing teams to focus on strategic decision-making instead of administrative tasks.
XI Technologies is constantly updating the data and reporting tools built into ARO Manager using expert opinion and adherence to government regulations. Users of ARO Manager can work with the standard XI Cost Model, or partially modify it to reflect their real-world costs, or even create an entirely custom cost model—all within a fraction of the time traditional methods require.
Stay tuned for our next post, “Did You Go Through Pain? – Is Your ARO Process Leaving You Stressed and Exhausted? – Part 2,” delves into struggles companies face when managing Asset Retirement Obligation (ARO) planning with spreadsheets—data errors, version control chaos, and compliance risks. These issues can drain time, resources, and increase financial risks. But there’s a solution: specialized ARO management software like XI Technologies’ ARO Manager. Discover how this tool streamlines your ARO process, improves collaboration, and ensures accuracy, all while saving time and reducing costs.
If you’re ready to stop the pain of spreadsheet chaos and take control of your ARO planning, it might be time to explore more advanced solutions.
Upcoming Events / Trainings:
ARO Manager For Financial Tracking and Reporting Certification Course provides practical, hands-on professional development for anyone interested in expanding their knowledge of Asset Retirement Obligation (ARO) tracking and reporting.
When: April 15th and April 17th at 9:00am
Space is limited so be sure to register now for the course. This is 2x half- day course taking place in person at the XI office.
AssetBook 101: This introduction to AssetBook course will help you identify potential new clients and opportunities for acquisitions, divestitures, mergers, trades, and farm-in potential.
When: April 15th at 2pm (in person at our Office)
Length: 1 Hour
ARO Manager 101: This introduction to AssetBook ARO Manager will help you create new projects, navigate, and view cost models.
When April 17th at 1pm (both are in person at our Office)
Length: 1 Hour
Follow the Molecule – AssetBook Production Chain: Learn how to run AssetBook’s latest feature – Production Chain.
When: April 24th at 1pm (Online)
Length: 30 minutes
Using LCA & LLR reports to your Advantage: Learn how to run an LCA and LLR report, and how these reports align with Directive 088 with regards to A&D Scoping.
When: April 29th at 9am (Online)
Length: 30 minutes
Getting the Most Out of Maps Information: Discover the available functions and workflows utilizing all aspects of the mapping tool, including:
- Searching using corners or polygons
- Layering sets of assets on the map
- Searching using mapped assets
- Workflow demonstrations to show assets on the map that meet set criteria
When: April 30th 1pm (Online)
Length: 30 minutes
Latest Webinars:
ARO Manager for Financial Tracking & Reporting
- Get a more complete picture of asset retirement costs.
- Cost management is a vital part of the business and operating strategy for every Canadian oil and gas producer. But if you are focused primarily on development and operations costs, then you are missing a significant part of the picture.
- AssetBook ARO Manager is the first and only software application specifically designed for estimating and monitoring asset retirement obligations (ARO) in the Western Canada oil and gas sector. For exploration and production companies, ARO Manager provides transparency and SOC-compliant assurance when monitoring and tracking liabilities for financial reporting.
H2S Reporting – Why Accuracy, Efficiency, and Compliance Matters
Struggling to meet H2S reporting requirements with limited resources or time? We’ve got you covered.
In our latest webinar, we provided valuable insights on:
- Regulatory rules and expectations, including revisions to Directive 056.
- How to ensure compliance, find efficiencies, save costs, and work as a team for consistent and transparent APEGA-approved reporting.
- Manage mergers, acquisitions and divestitures with ease (no duplication of reports).
- Learn about H2SComplete as a full solution to help you quickly manage and mitigate risks associated with hydrogen sulfide (H2S) safety.
XI Technologies has moved to our NEW LOCATION:
XI Technologies Inc.
2400 – 500 4th Avenue SW (Altius Centre)
Calgary, Alberta T2P 2V6
Curious to learn more about XI’s product suites? Book a product demo today!
The number of users for XI Technologies modules is not limited to individual seats. The modules are accessible on a corporate wide subscription. Your company may have a XI Technologies AssetBook subscription. To register for access to your corporate account, click here.
—
Each week, XI Technologies uncovers trends and insights using our enhanced data and software focused on the WCSB. If you’d like Word to the Wise delivered directly to your inbox, subscribe here. For more tips and to learn about how XI’s AssetSuite can help with your high-level analysis visit XI’s website or contact XI for a demo.
Whitecap Resources Inc. (“Whitecap”) and Veren Inc. (“Veren”) have announced a strategic combination for $15 billion. The result of this all-share merger is the creation of the largest landholder in Alberta’s Montney and Duverney regions, two of North America’s most important shale plays. In this article, XI Technologies uses AssetBook – the largest asset evaluation tool in the Western Canadian Sedimentary Basin (WCSB) – to analyze the potential strategies involved.
First, AssetBook has identified Whitecap at roughly 170k barrels of oil per day (BOE/d) and Veren at $167k BOE/d, jumping this new company into the 5th spot of largest producers in the WCSB, with the top spots still held by Canadian Natural Resources Ltd at $948k BOE/d, Cenovus Energy Inc. at $779k BOE/d, Tourmaline Oil Corp. at 542k BOE/d and Ovintiv Canada Ulc at $343k BOE/d.
This deal would translate to a new company valuation of roughly $44,500 a flowing boe using the AssetBook ownership module. XI uses a 6:1 Boe ratio which, given the liquid nature of the main gas play for this deal, will be a little conservative. Using the valuation from the press report, the company is claiming a combined boe of $370,000 or $40,540 a flowing boe. As AssetBook does not include any production from mined operations, our numbers are for production that is coming from wells only.
Next, XI Technologies evaluated the Whitecap and Veren combination through different lenses using AssetSuite software tools, looking at each company’s asset profile plus the combined entity, to gain valuable insight into the transaction. Consideration was given to the fall out and which other players in the area may be affected. This deep dive gives a comprehensive understanding and full picture of the resulting acquisition.
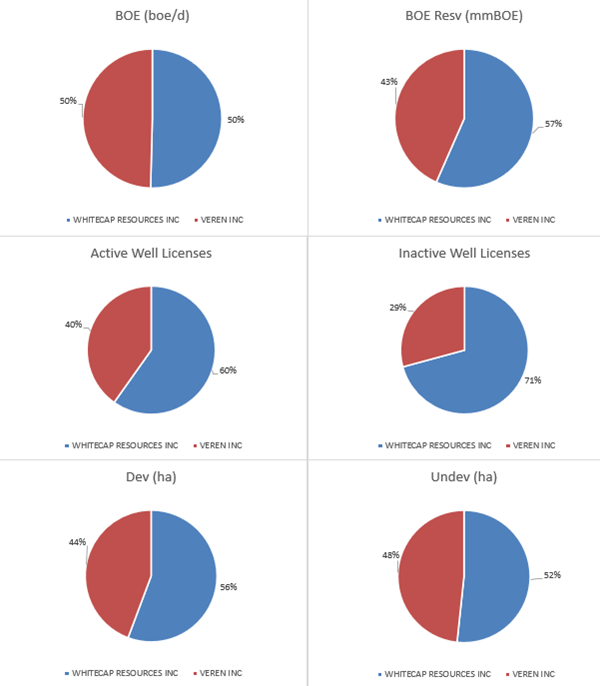
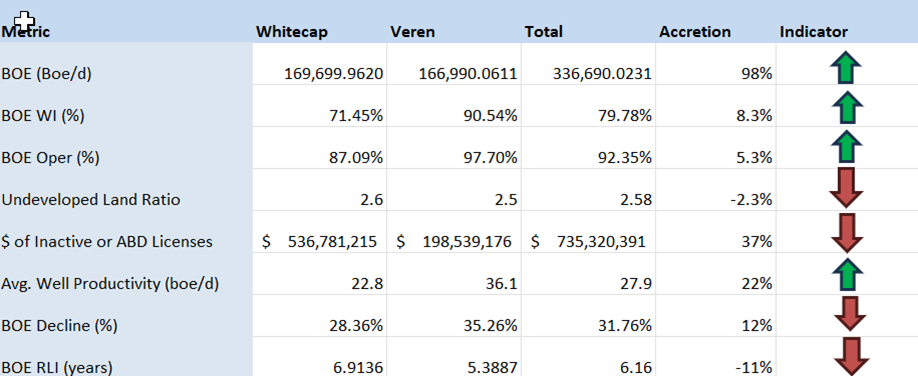
While the absolute numbers tell one story, accretion and dilution metrics tell us more. Looking at the AssetSuite summary, we can calculate some accretion and dilution metrics for this transaction relative to the increase in production.
Per Figure 2 below, based on Whitecap absorbing Veren, Whitecap’s production base will almost double through this acquisition, while liabilities will only increase by 37%. The Veren assets don’t appear to be quite as long lived as Whitecap’s base, but they do potentially add operational efficiency with a substantial increase in the average well rate.
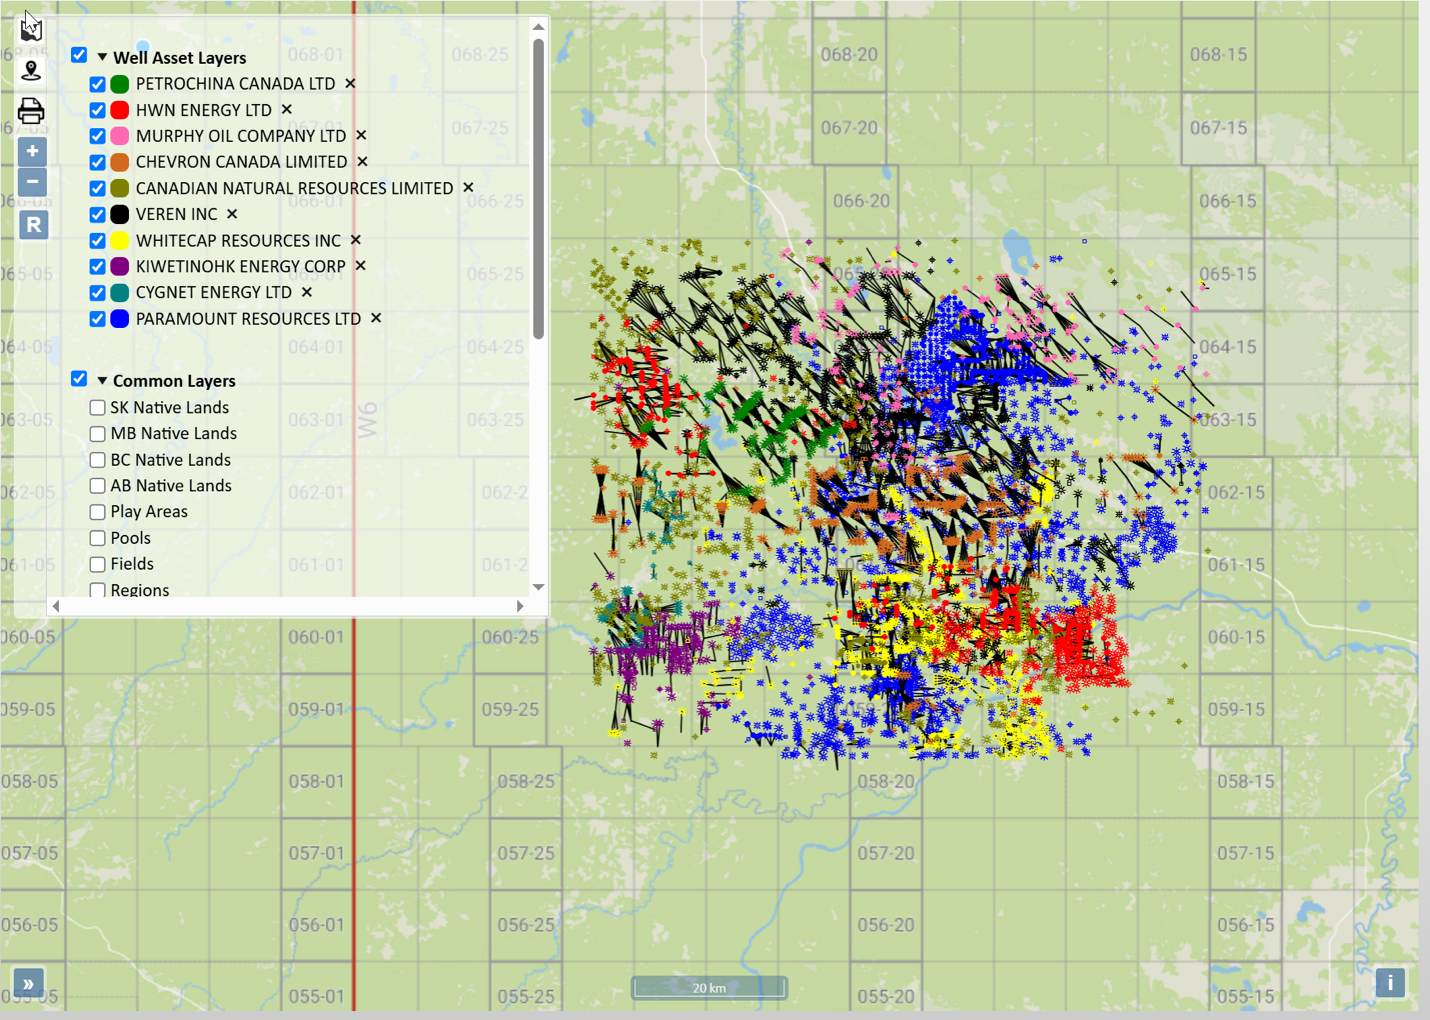
The best way to see the core of this deal is to overlay Veren’s production heat map on Whitecap’s well map. Both companies are quite spread out making it unlikely that anything will become a fall out property from this deal.
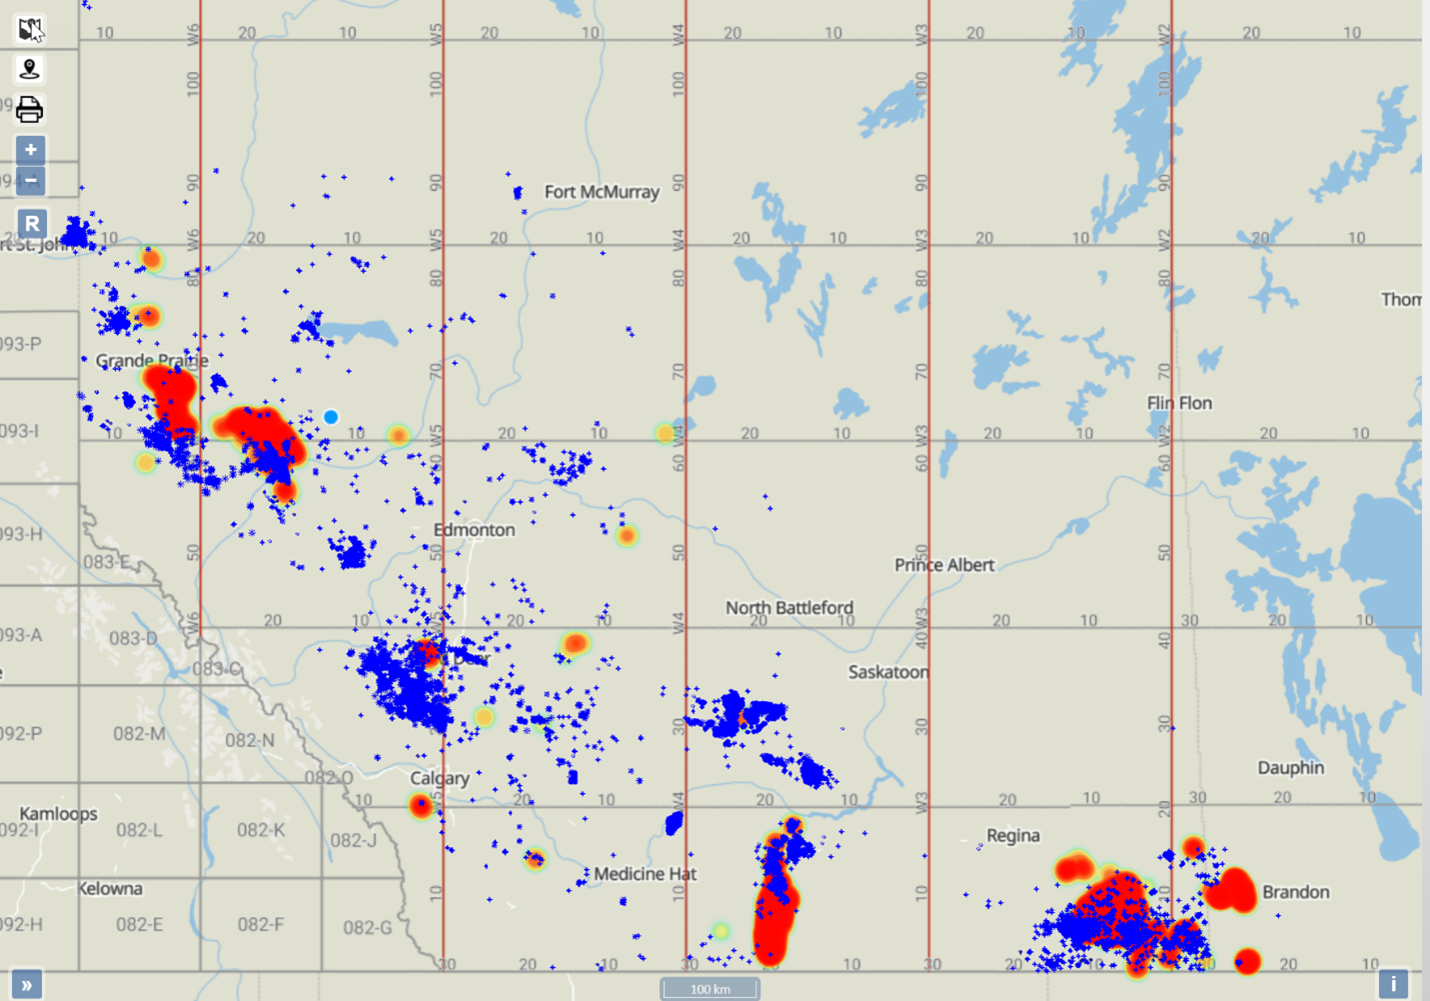
We can also view the combined production in a heat map (Figure 4 below) to see where the largest increases are.
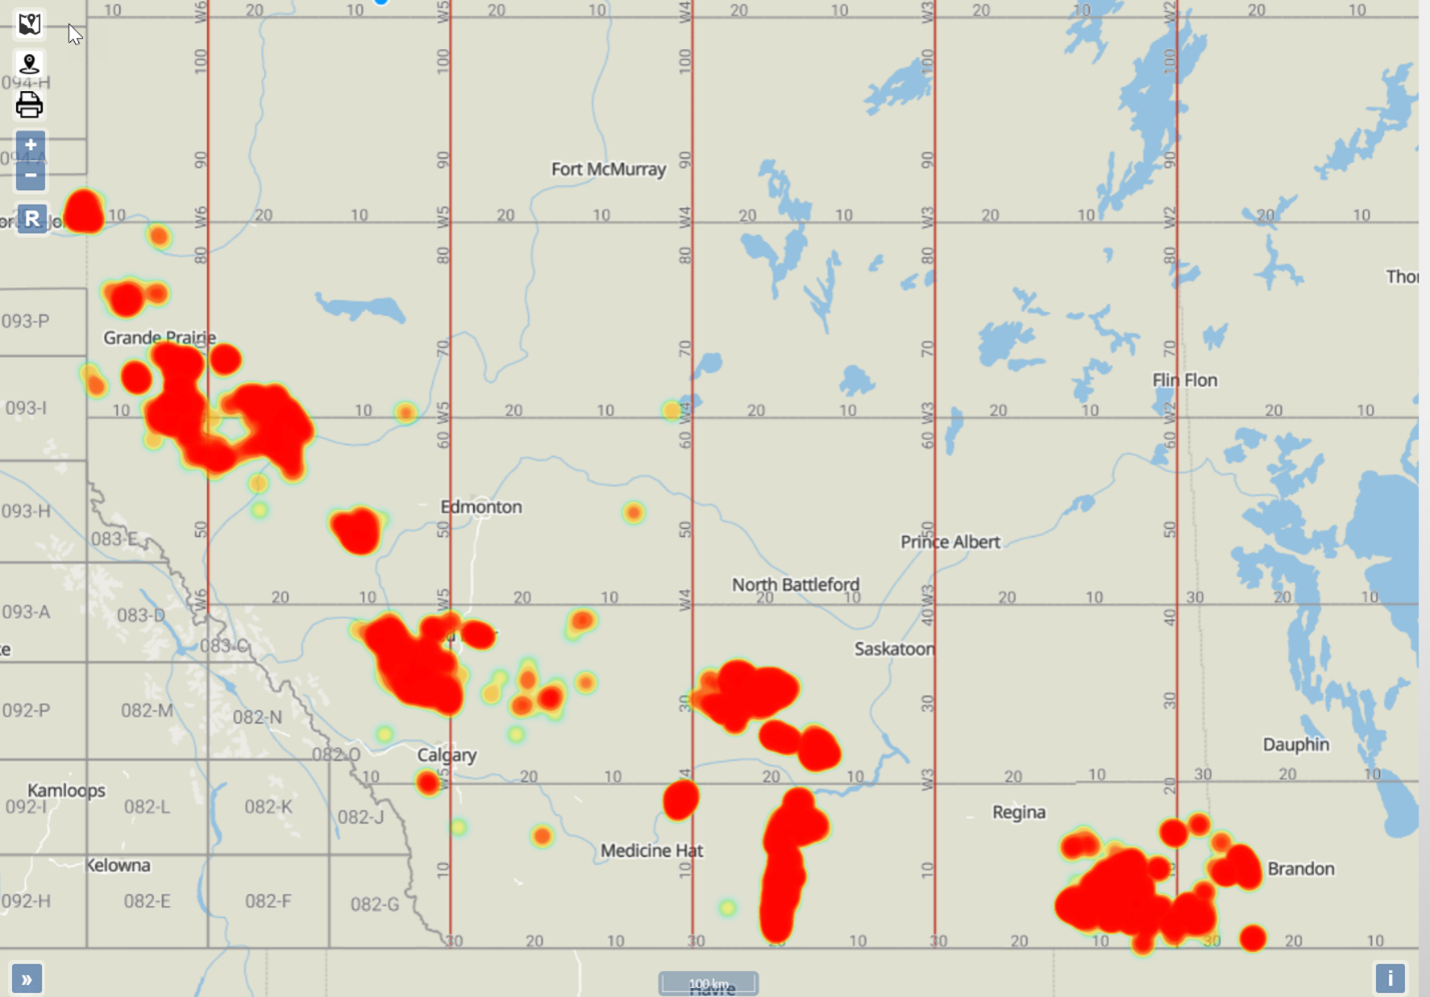
Figure 4 – Map of Whitecap and Veren assets. Source: XI Technologies AssetBookAs this arrangement augments the production in Montney and Duverney plays, it is worth looking at the production graph for each.
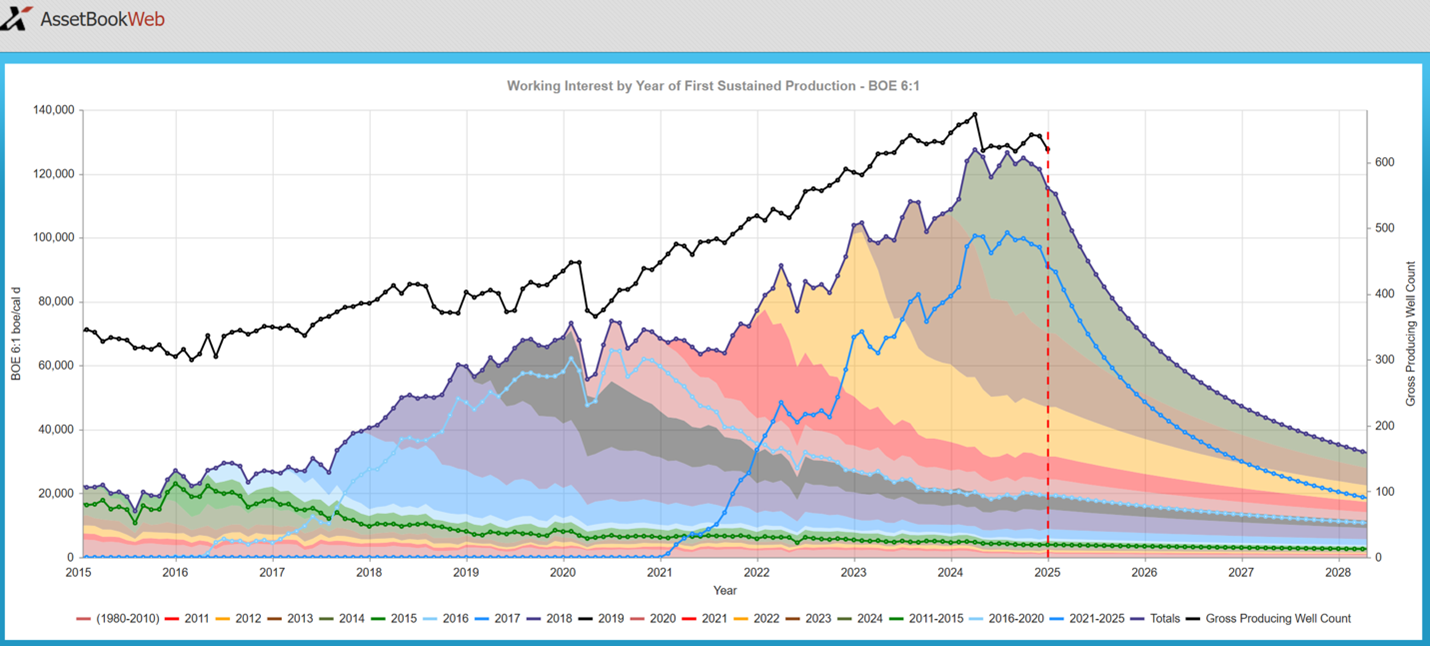
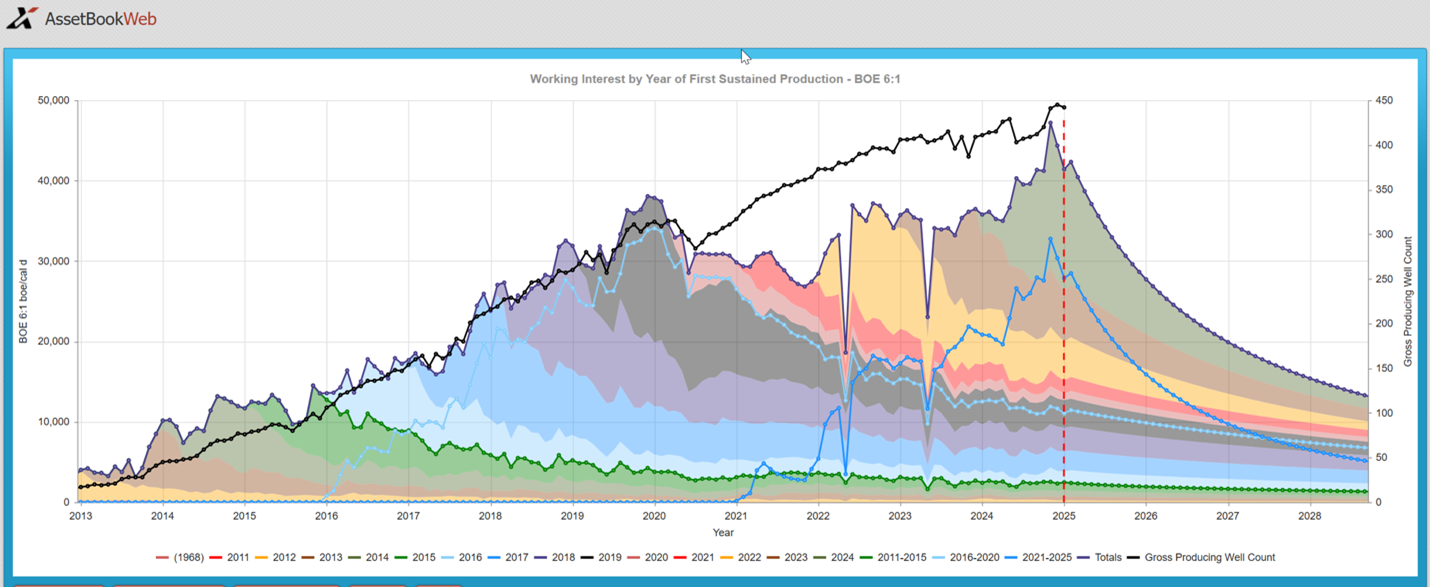
Figure 5 & 6 – Graph of zones for Whitecap and Veren combined assets – Montney Play and Duvernay Play respectively. Source: XI Technologies AssetBook
A CORE AREA OVERVIEW
With the AssetBook we can create an area around the different plays or geographical interests and analyze the competition or potential further acquisition opportunities. Let’s view their Duvernay area and see what strategic moves could be addressed.
Drawing a box from 59-16 to 65-24 below gives us a good bounding around this play for this new entity. This area is predominantly Duvernay production with approximately 74% of the production coming from this zone.
The new Veren/Whitecap entity is the largest player in this area with approximately 56,213 boe/d of the 174,448 boe/d producing from this area, representing 32.23% of the region’s total production. The area has 55 producers and over 80% of the production is held by the top 10 producers. This is primarily a gas producing area with slightly more than 85% of the production coming from gas. Download more information on the companies in this area here.
Want to learn how to discover these metrics on your own, or use XI’s AssetSuite to evaluate your next merge or acquisition? Book a product demo today!
Upcoming Events / Trainings:
AROManager Webinar:
ARO Manager for Financial Tracking & Reporting
- Get a more complete picture of asset retirement costs.
- Cost management is a vital part of the business and operating strategy for every Canadian oil and gas producer. But if you are focused primarily on development and operations costs, then you are missing a significant part of the picture.
- AssetBook ARO Manager is the first and only software application specifically designed for estimating and monitoring asset retirement obligations (ARO) in the Western Canada oil and gas sector. For exploration and production companies, ARO Manager provides transparency and SOC-compliant assurance when monitoring and tracking liabilities for financial reporting.
March 25th, 2025, 9:00am (MST) hosted online. Register today!
ARO Manager For Financial Tracking and Reporting Certification Course provides practical, hands-on professional development for anyone interested in expanding their knowledge of Asset Retirement Obligation (ARO) tracking and reporting.
When: April 15th and April 17th at 9:00am
Space is limited so be sure to register now for the course. This is 2x half- day course taking place in person at the XI office.
AssetBook 101: This introduction to AssetBook course will help you identify potential new clients and opportunities for acquisitions, divestitures, mergers, trades, and farm-in potential.
When: April 15th at 2pm (in person at our Office)
Length: 1 Hour
ARO Manager 101: This introduction to AssetBook ARO Manager will help you create new projects, navigate, and view cost models.
When: March 20th at 9am and April 17th at 1pm (both are in person at our Office)
Length: 1 Hour
Getting the Most Out of Maps Information: Discover the available functions and workflows utilizing all aspects of the mapping tool, including:
- Searching using corners or polygons
- Layering sets of assets on the map
- Searching using mapped assets
- Workflow demonstrations to show assets on the map that meet set criteria
When: April 30th 1pm (Online)
Length: 30 minutes
Using LCA & LLR reports to your Advantage: Learn how to run an LCA and LLR report, and how these reports align with Directive 088 with regards to A&D Scoping.
When: April 29th at 9am
Length: 30 minutes
H2S Reporting – Why Accuracy, Efficiency, and Compliance Matters
Struggling to meet H2S reporting requirements with limited resources or time? We’ve got you covered.
In our latest webinar, we provided valuable insights on:
- Regulatory rules and expectations, including revisions to Directive 056.
- How to ensure compliance, find efficiencies, save costs, and work as a team for consistent and transparent APEGA-approved reporting.
- Manage mergers, acquisitions and divestitures with ease (no duplication of reports).
- Learn about H2SComplete as a full solution to help you quickly manage and mitigate risks associated with hydrogen sulfide (H2S) safety.
XI Technologies has moved to our NEW LOCATION:
XI Technologies Inc.
2400 – 500 4th Avenue SW (Altius Centre)
Calgary, Alberta T2P 2V6
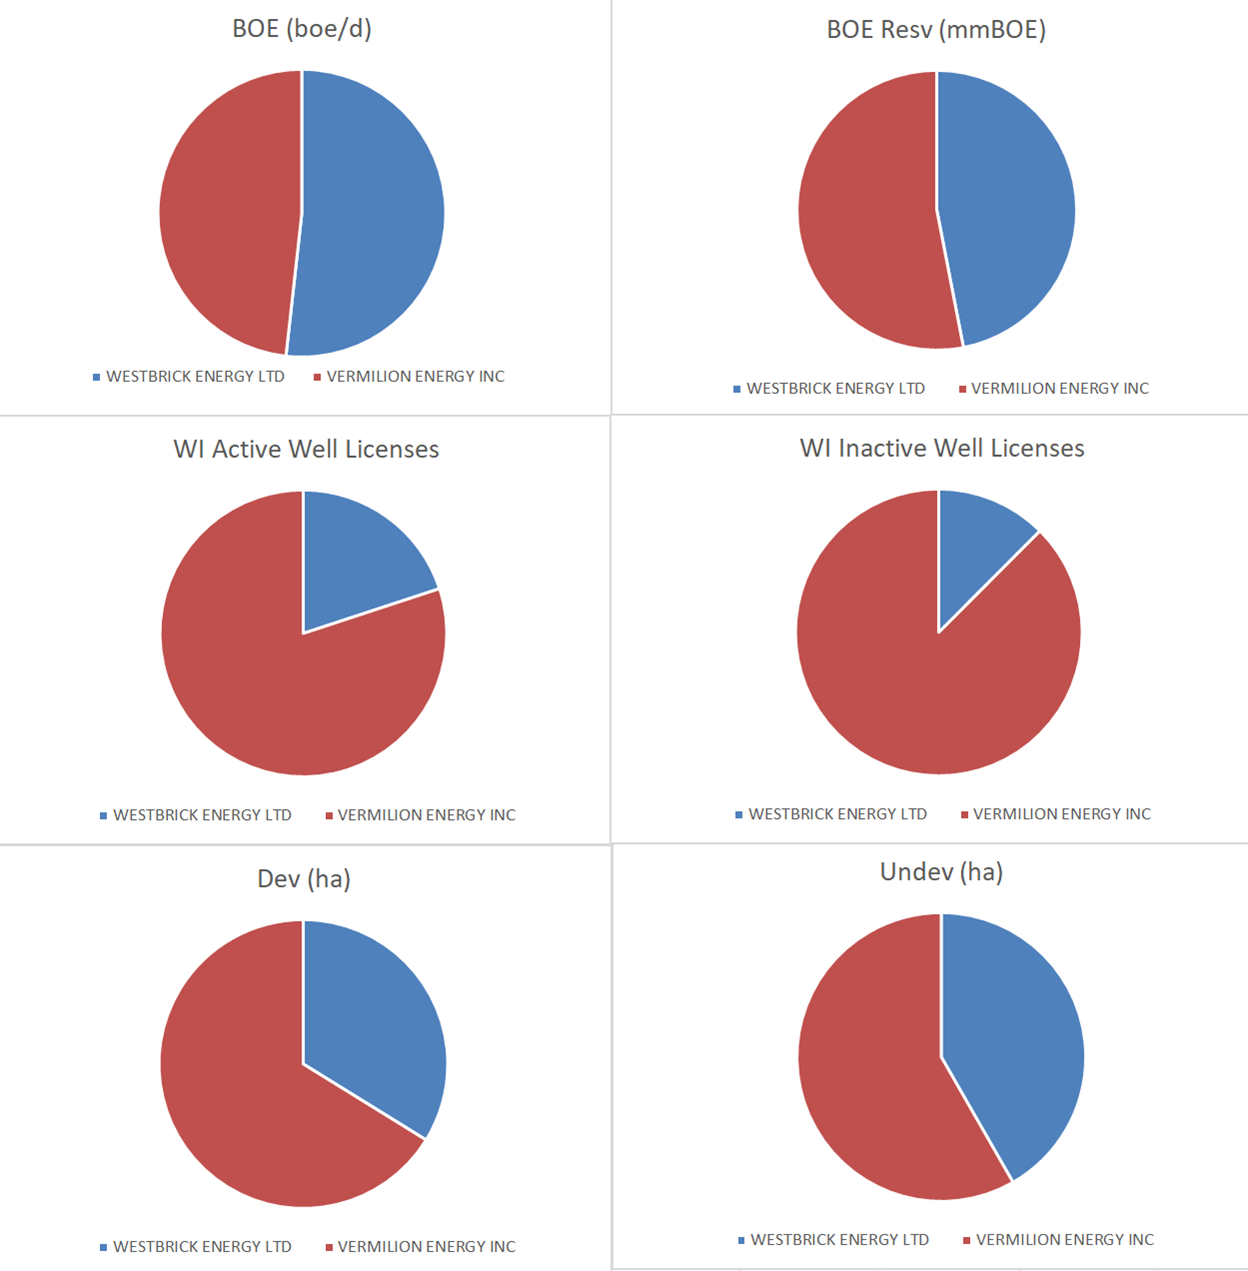
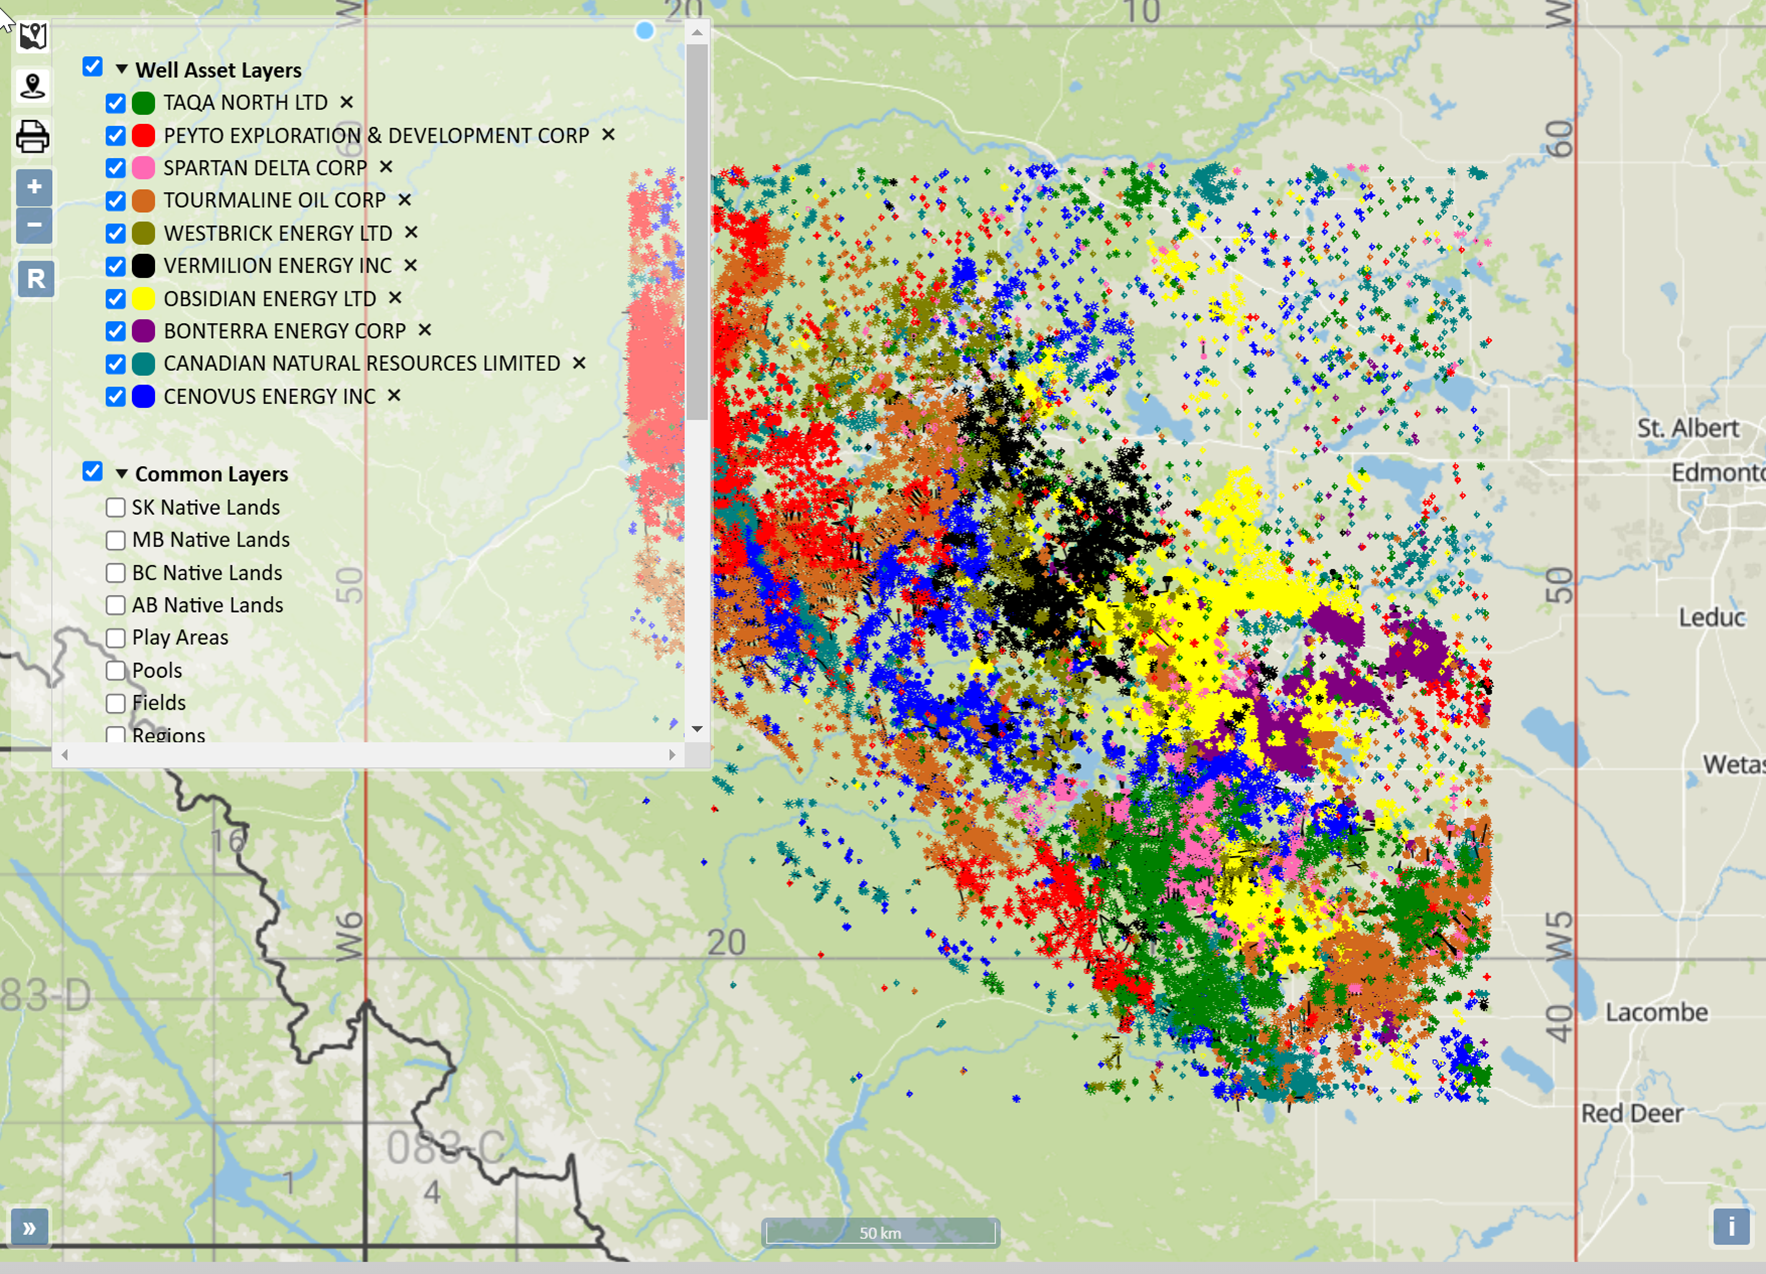
Vermilion Energy Inc. (Vermilion) has announced that it is acquiring Westbrick Energy Ltd. (Westbrick) for $1.075 billion. XI’s AssetBook has identified roughly 44,700 boe/day compared to the news articles that have identified the deal at 50,000 boe/day. This translates to roughly between $21,000 and $24,000 per flowing boe. Looking back at other gas transactions, Tourmaline acquired Bonavista for $1.45 billion, which, based on AssetBook’s 6:1 ratio, translated to a valuation of about $30,400 per barrel of oil equivalent per day (boe/d). Tourmaline also purchased Crew, a valuation around $44,000 per boe/d. As these two Tourmaline purchases dealt with a greater proportion of liquid rich gas, these metrics make sense.
XI Technologies evaluated the Vermillion acquisition of Westbrick through different lenses using AssetSuite software tools and looked at each company’s asset profile, plus the combined entity, to gain valuable insight into the transaction. Consideration was also given to the fall out and which other players in the area may be affected. This deep dive gives a comprehensive understanding and full picture of the resulting acquisition.
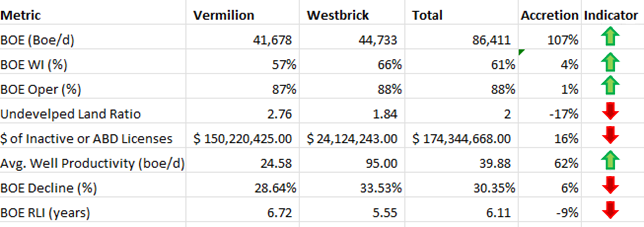
While the absolute numbers tell one story, accretion and dilution metrics tell us more. Looking at the AssetSuite summary, we can calculate some accretion and dilution metrics for this transaction relative to the increase in production.
Per Figure 2 below, Vermilion’s production base will more than double through this acquisition, while liabilities will only increase by 16%. The Westbrick assets don’t appear to be quite as long lived as Vermilion’s base, but they do potentially add operational efficiency with a substantial increase in the average well rate.
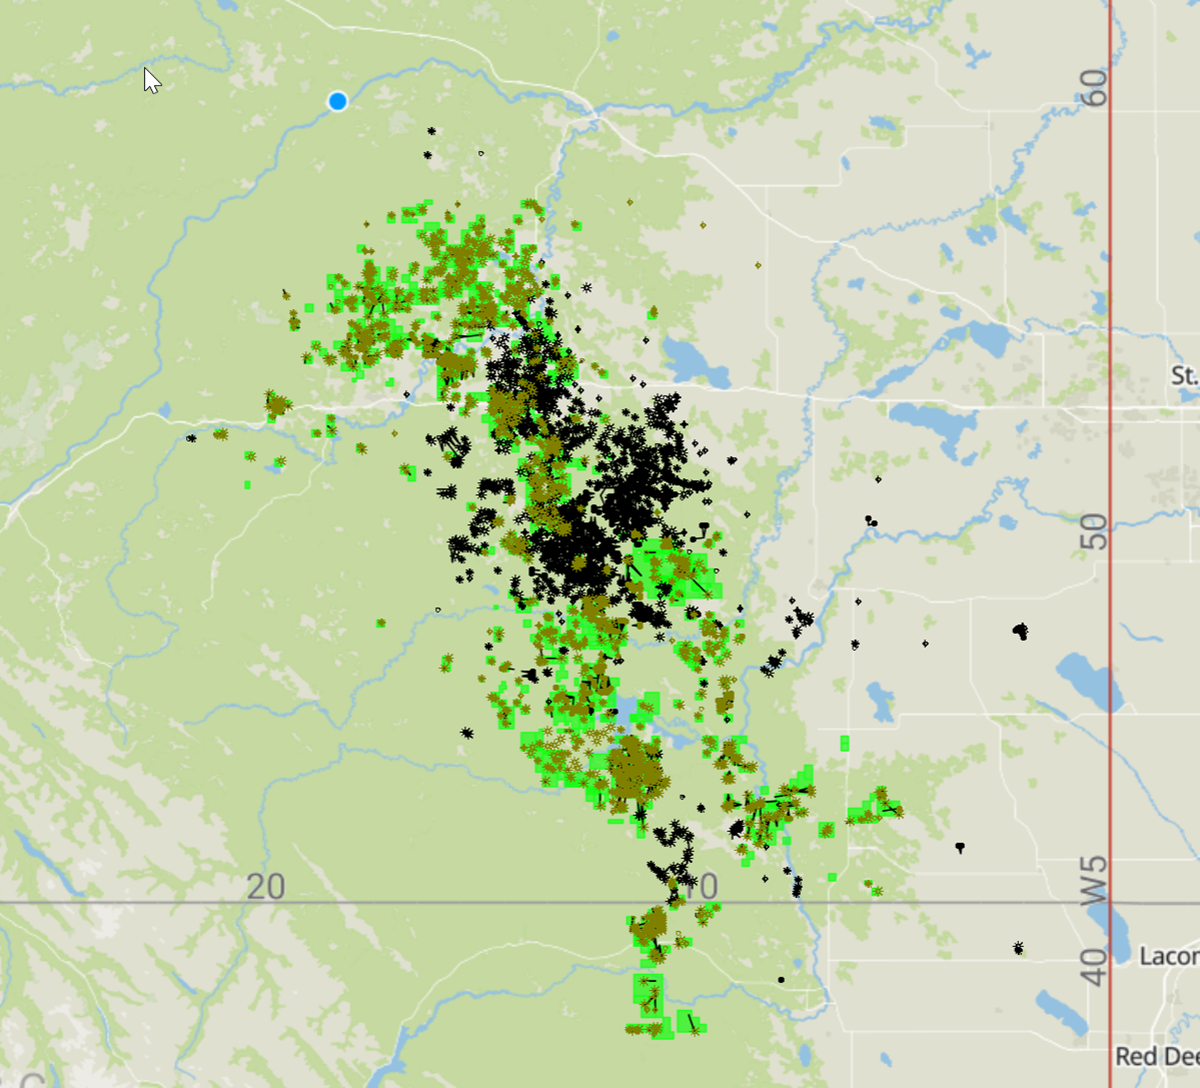
The best way to see the core of this deal is to overlay Westbrick’s production heat map on Vermilion’s well map. Westbrick’s assets are very concentrated, so it is easy to evaluate other players in this area.
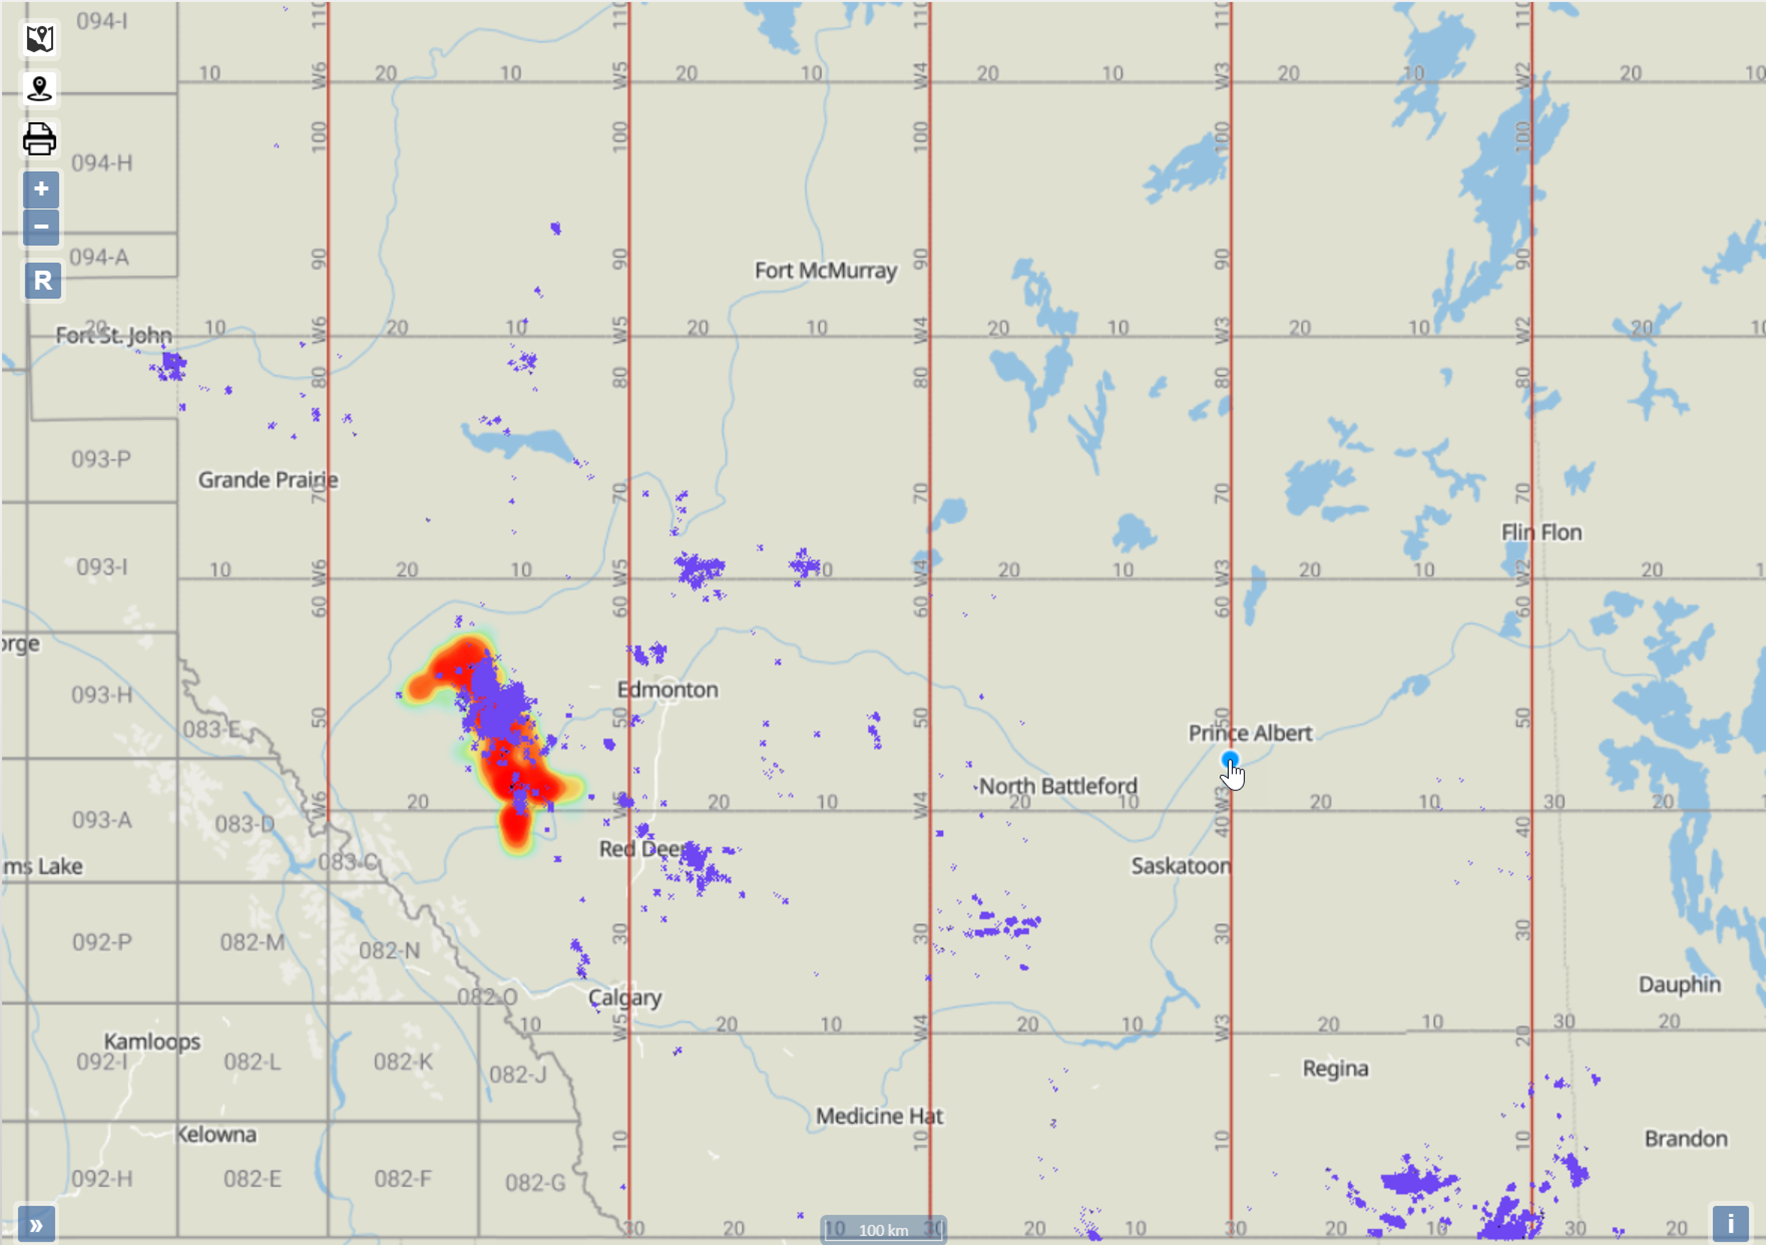
Expanding Vermilion’s central Alberta assets, this acquisition augments their production around the Pembina field. Combining Vermilion’s assets with Westbrick shows that these assets are in a diverse number of Zones as shown below.
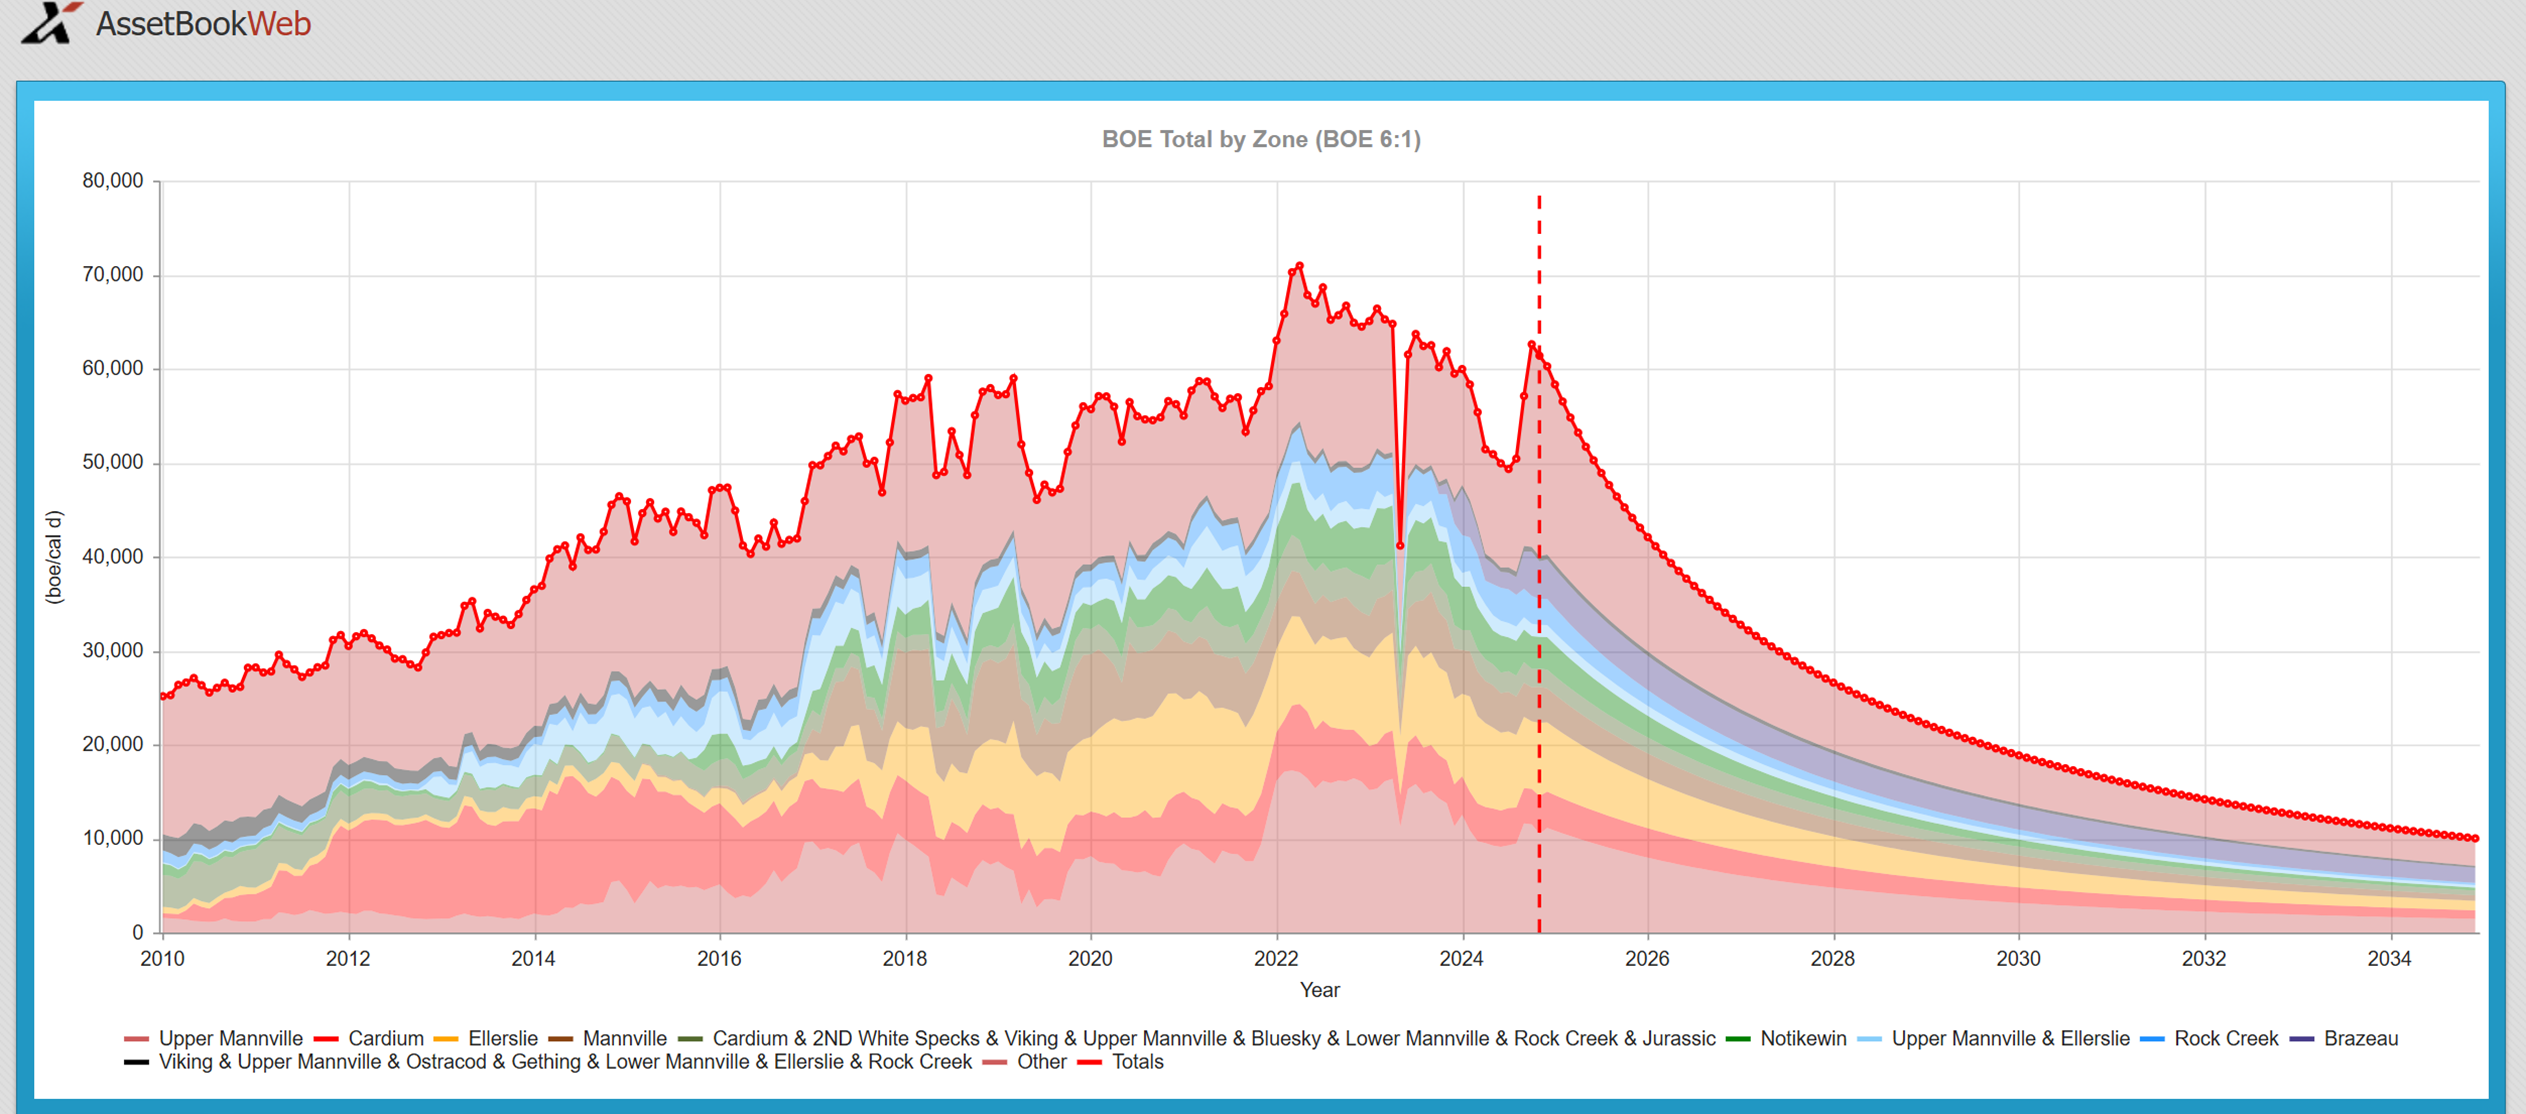
The land holdings involved in this deal are a crucial component of its strategic value. Westbrick’s assets are notably concentrated, offering Vermilion an opportunity to enhance its operational efficiencies and expand its presence around the Pembina field. The overlapping asset base creates a seamless integration, adding diversity to Vermilion’s production portfolio. With these new holdings in a variety of geological zones, Vermilion gains access to untapped potential and significant room for future development. The consolidation of these concentrated assets further underscores the importance of strategic land positioning in Alberta’s competitive energy market.
A CORE AREA OVERVIEW
With the AssetBook we can create an area around each of these and see all other players in that region. Tourmaline Energy is the largest player in this area with approximately 81,000 boe/d of the 566,069 boe/d producing from this area. The area has 151 producers and just under 75% of the production is held by the top 10 producers. This is primarily a gas producing area with a little more than 86% of the production coming from gas. Download more information on the companies in this area here.
This acquisition not only cements Vermilion’s strategic position in this region but also sets a benchmark for similar transactions in the sector. By integrating Westbrick’s concentrated and efficient asset base, Vermilion is poised to optimize production while managing liabilities effectively, as shown in the accretion metrics. With other key players like Tourmaline and Crew already setting the tone for valuation in the region, Vermilion’s move highlights a broader trend of consolidation and efficiency in Alberta’s energy landscape. As this deal unfolds, it will be fascinating to observe its ripple effects across the industry and the potential opportunities it creates for further collaboration or competition in the area.
EMISSIONS PROFORMA ANALYSIS
Vermilion Energy has a robust sustainability vision, with a stated goal to reduce Scope 1 GHG Intensity by 15-20% below their 2019 baseline by 2025, focusing initially on methane reduction in line with AER regulations. Large scale acquisitions of this magnitude, primarily driven by financial metrics, can have a major impact on stated ESG or emissions targets.
A high-level analysis using XI’s Emissions Report noted that while Vermillion is doubling its production, it’s intensity factor will remain essentially unchanged (if anything it will drop a little) based on our proforma reporting.
This was likely a big factor for Vermillion. For any company, early-stage high-level analysis of post-transaction emissions materiality during the scoping phase, especially when looking at multiple packages, saves time, identifies emissions-related red flags, and helps mitigate any potential impacts against stated ESG targets and goals.
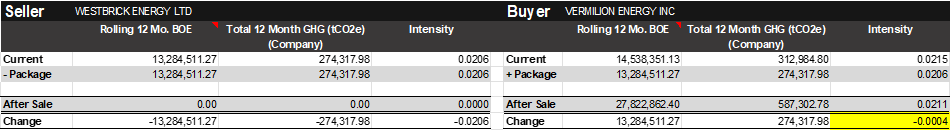
* Please note that our reporting is built from the data using XI’s proprietary emissions factors and published emissions volumes. The numbers may not match a company’s reported sustainability values, but the XI methodology allows for apples-to-apples assessments at a high level, instantly. Trailing 12-month BOE and CO2e values are current until November 2024.
Upcoming Events / Trainings:
H2SComplete Webinar:
With XI’s H2SComplete service you’ll receive expert analysis and documentation of your H2S release rate assessment for compliant well licensing (AER Directive 056).
- Fast Results – Reports delivered in under one week
- Low cost – Spend hundreds, not thousands on data analysis
- Expert analysts – Professionals with years of regulatory experience doing the work
- Delegated tasks – Let your engineers be engineers, not data hunters
- Improved due diligence – Individual assessments per location (preferred by the AER) without added cost or redundancy
February 27th, 2025, 9:00am (MST) hosted online. Register today!
ARO Manager For Financial Tracking and Reporting Certification Course provides practical, hands-on professional development for anyone interested in expanding their knowledge of Asset Retirement Obligation (ARO) tracking and reporting.
When: April 15th and April 17th at 9:00am
Space is limited so be sure to register now for the course. This is 2x half- day course taking place in person at the XI office.
AssetBook 101: This introduction to AssetBook course will help you identify potential new clients and opportunities for acquisitions, divestitures, mergers, trades, and farm-in potential.
When: March 18th at 1pm and April 15th at 2pm (both are in person at our Office)
Length: 1 Hour
ARO Manager 101: This introduction to AssetBook ARO Manager will help you create new projects, navigate, and view cost models.
When: March 20th at 9am and April 17th at 1pm (both are in person at our Office)
Length: 1 Hour
Getting the Most Out of Maps Information: Discover the available functions and workflows utilizing all aspects of the mapping tool, including:
- Searching using corners or polygons
- Layering sets of assets on the map
- Searching using mapped assets
- Workflow demonstrations to show assets on the map that meet set criteria
When: March 3rd 11am and April 30th 1pm (Online)
Length: 30 minutes
Using LCA & LLR reports to your Advantage: Learn how to run an LCA and LLR report, and how these reports align with Directive 088 with regards to A&D Scoping.
When: March 4th 2pm and April 29th at 9am
Length: 30 minutes
XI Technologies has moved to our NEW LOCATION:
XI Technologies Inc.
2400 – 500 4th Avenue SW (Altius Centre)
Calgary, Alberta T2P 2V6
The oil and gas industry faces increasing pressure to manage Asset Retirement Obligations (ARO) with accuracy and transparency. For Burgess Creek Exploration (BCX), an oil and gas company with a disciplined focus on conventional oil and gas reservoirs, this was a challenge. Relying on an Excel-based model, BCX struggled with issues related to data integrity, time-consuming audits, and the lack of flexibility to model various cost scenarios.
The Problem: Excel Limitations
BCX had been using Excel for ARO management, but this method presented a number of drawbacks. Excel, while powerful, proved difficult to maintain and prone to errors when used across multiple teams. The lack of transparency and the inability to track changes made auditing a lengthy and resource-draining task. Furthermore, Excel lacked the flexibility needed to adjust to varying ARO cost scenarios across different assets.
The Solution: XI Technologies’ AssetBook ARO Manager
To address these challenges, BCX turned to XI Technologies’ AssetBook ARO Manager. This comprehensive tool helped BCX transition from Excel to a robust database system for managing their ARO data. With the ARO Manager, BCX was able to:
- Easily populate data from Excel and align it with accounting and operational systems
- Ensure data integrity through real-time tracking of changes, with clear audit trails
- Flexibly assess ARO costs and conduct scenario analysis to evaluate different cost models
The transition to AssetBook ARO Manager provided BCX with a more efficient, transparent, and auditable system for managing ARO. The tool’s advanced capabilities also allowed BCX to quickly assess and report on ARO data, which proved invaluable during the company’s sale process.
The Results: Streamlined Processes and Transparent Reporting
The most significant result of adopting the ARO Manager was the drastic reduction in time spent on quarterly audits. BCX went from spending hours to prepare ARO reports in Excel to completing the task in less than a quarter of the time.
Recently, XI Technologies celebrated its 30th anniversary. Going through old pictures and material, we reflected on our roots as Touch Tone Data, progressing through fax machines, DVD data sets, and current web-based platforms. The use of technology continues to streamline the effective use of data in oil and gas operations and A&D.
Who remembers data binders? Back in the day, you signed a CA, couriered or faxed it in, and patiently waited for your data set to be delivered. The and, accounting, and reserves report would be printed out and indexed into multiple binders, depending on the size of the potential deal. Advisors had small staff armies creating and collating these binders. Once the deal closed, they recalled said binders to destroy the data.
Using the printout and, later, the PDF, the reserves report would be used to painstakingly create your evaluation database so you could do your analysis, update production and land information, and vet the operating costs from lease operating statements to run price deck sensitivities. Te.Di.Ous.
Fast-forward to today, data rooms are online and effectively disseminate immense amounts of data to prospective buyers quickly, transparently, and verifiably. Among that data is a copy of the seller’s reserves database, likely in multiple formats or one that is easily input and converted between evaluation programs. It is the expected standard, allowing prospective buyers more time to focus on effectively assessing the value of an offering rather than recreating the evaluation.
Can’t see the form? Contact us and we’ll send you the case study.
Upcoming Certification Course:
ARO Manager For Financial Tracking and Reporting Certification Course provides practical, hands-on professional development for anyone interested in expanding their knowledge of Asset Retirement Obligation (ARO) tracking and reporting.
When: April 15th and April 17th at 9:00am
Space is limited so be sure to register now for the course. This is 2 x half- day course taking place in person at the XI office.
XI Technologies has moved to our NEW LOCATION:
XI Technologies Inc.
2400 – 500 4th Avenue SW (Altius Centre)
Calgary, Alberta T2P 2V6
Each week, XI Technologies uncovers trends and insights using our enhanced data and software focused on the WCSB. If you’d like Word to the Wise delivered directly to your inbox, subscribe here. For more tips and to learn about how XI’s AssetSuite can help with your high-level analysis visit XI’s website or contact XI for a demo.
A year ago we talked about how The Alberta Energy Regulator (AER) has introduced a significant overhaul in its approach to licensee assessments with the launch of Directive 88 and the accompanying Manual 23. Guidelines aimed at providing a comprehensive, holistic framework for evaluating licensees across five key areas:
- Licensee Capability Assessment
- License Transfers
- Licensee Management Programs
- Inventory Reduction Programs
- Security Deposits
In that post, we focused specifically on the License Transfers component and explore how stakeholders could navigate these changes.
Transparency Challenges in License Transfers
A recurring theme among stakeholders in the license transfer process—whether it’s E&P companies, bankers, lawyers, or investors—is the lack of transparency. This has not changed from Directive 88’s implementation. Many institutions, including banks and lenders, continue to rely on the traditional Liability Management Rating (LLR) ratio to guide their decisions, as it offers clear, easily understandable metrics. Whereas, the calculations behind the LCA metrics often remain opaque. Given that most license transfer transactions trigger regulatory reviews, stakeholders often question whether it’s worth the effort to fully decipher the complex data involved.
While Directive 88 may initially seem like a “black box,” it does provide an outline for evaluating the key factors that influence the deal. Once confidentiality agreements are in place, the information required by the AER under this directive aligns closely with the metrics needed to assess a deal. These calculations are crucial for identifying potential cost obligations and streamlining the transaction process.
A Peek Behind the Black Box: Licensee Assessment (LCA)
In November 2023, our team was invited to present at the PADA Society breakfast, hosted in collaboration with Burnet, Duckworth & Palmer LLP (BD&P). During this session, we discussed how the new framework is shaping deal-making in the energy sector. After BD&P’s insightful overview of Directive 88 and its impact on current transactions, we shared methods for reverse-engineering the AER’s Licensee Capability Assessment (LCA) metrics using publicly available data. The goal was to offer attendees a “peek beyond the black box” of regulatory assessments. This same principle applies one year later.
The AER classifies licensee capability into two main categories: Risk and Performance.
- Risk: This group assesses a company’s financial distress level and the magnitude of its liabilities.
- Performance: This category evaluates operational factors like the remaining lifespan of resources, operational efficiency, closure plans, and ongoing administration.
By understanding these categories, companies can be grouped and prioritized based on their potential risks and performance. This allows regulators to identify liabilities and risks that must be mitigated by the licensee before transferring the license.
Estimating Licensee Profiles and Transaction Timelines
The good news is that a wealth of public data is available to help estimate a company’s licensee profile and gauge how long a transfer might take. By strategically compiling and analyzing this data, you can begin to estimate critical factors like the remaining lifespan of resources, which can significantly influence your deal structure.
For the purposes of this article, we’ll focus on one specific performance factor: the Remaining Lifespan of Mineral Resources. However, if you’re interested in exploring the other assessment categories and where to find the data, be sure to download our whitepaper on Licensee Capability Assessment and Transparency.
The Role of the Remaining Lifespan of Resources
The AER’s framework defines the Remaining Lifespan of Mineral Resources through a set of key metrics, such as:
- Production Trend: The trajectory of a company’s production over time.
- Inactive Well Ratio: The percentage of wells that are no longer producing.
- Marginal Well Ratio: The proportion of wells producing less than 10 boe/d.
- Inactive Facility Ratio: The percentage of facilities that are inactive.
- Crossover Timeline: The date when a company’s production is expected to significantly decline.
These factors provide insights into a company’s operational efficiency and its ability to meet future closure and reclamation obligations.
A Real-World Example: Junior Peer Group Comparison
To better illustrate how these factors work, let’s take a look at companies from the Junior Natural Gas and Liquid Rich Gas Peer Group (as classified by the AER) that have LLR ratios above 2, based on the newest cost model calculation from Directive 11, and using an industry standard 6:1 boe ratio.
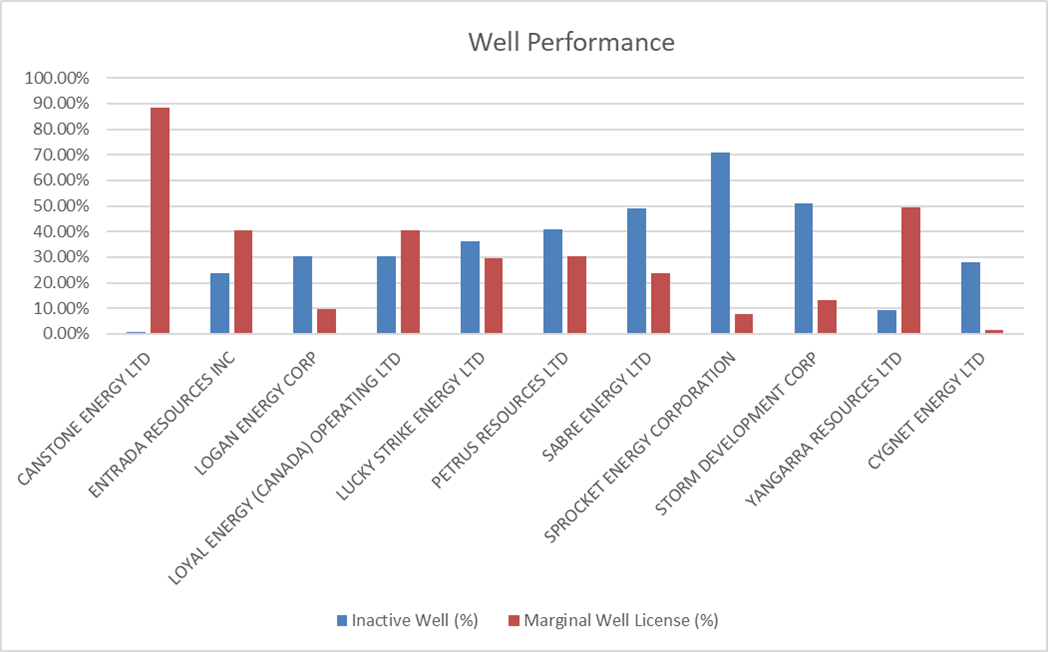
The second comparison highlights how different companies in the same peer group may have varying operational efficiencies and risk profiles, which can impact their ability to meet future obligations. While these are basic data points, there are obviously many factors to consider when evaluating both opportunities and risks. For instance, all of these companies had crossover dates calculated by XI well into the future, indicating these assets are very sustainable.
Benchmarking with Public Data
By utilizing publicly available data, you can benchmark companies in the same peer group against one another based on their Remaining Lifespan of Resources. This allows you to quickly identify those with stronger operational metrics or longer resource lifespans, providing valuable insight into the potential risks and rewards associated with a deal.
For a more detailed comparison, download the full LCA report, where you can explore how these companies rank across a range of factors.
The Bottom Line: Key Takeaways for License Transfers
While the full scope of the AER’s Directive 88 can be complex, the Remaining Lifespan of Resources factor offers an accessible starting point for evaluating potential license transfers. By understanding the key metrics and utilizing available public data, stakeholders can better navigate the deal process, uncover hidden risks, and structure transactions more effectively.
If you’re looking to dive deeper into the nuances of the AER’s framework, including how to calculate potential liabilities and security deposits, be sure to check out our full whitepaper and LCA report. And remember, in a rapidly evolving regulatory environment, staying informed and adaptable is key to successfully executing license transfers.
Want More Insights?
- Download our whitepaper: Learn how to reverse-engineer the AER’s licensee capability assessments using public data.
- Explore our LCA report: See how companies in the Junior Peer Group measure up against key performance metrics.
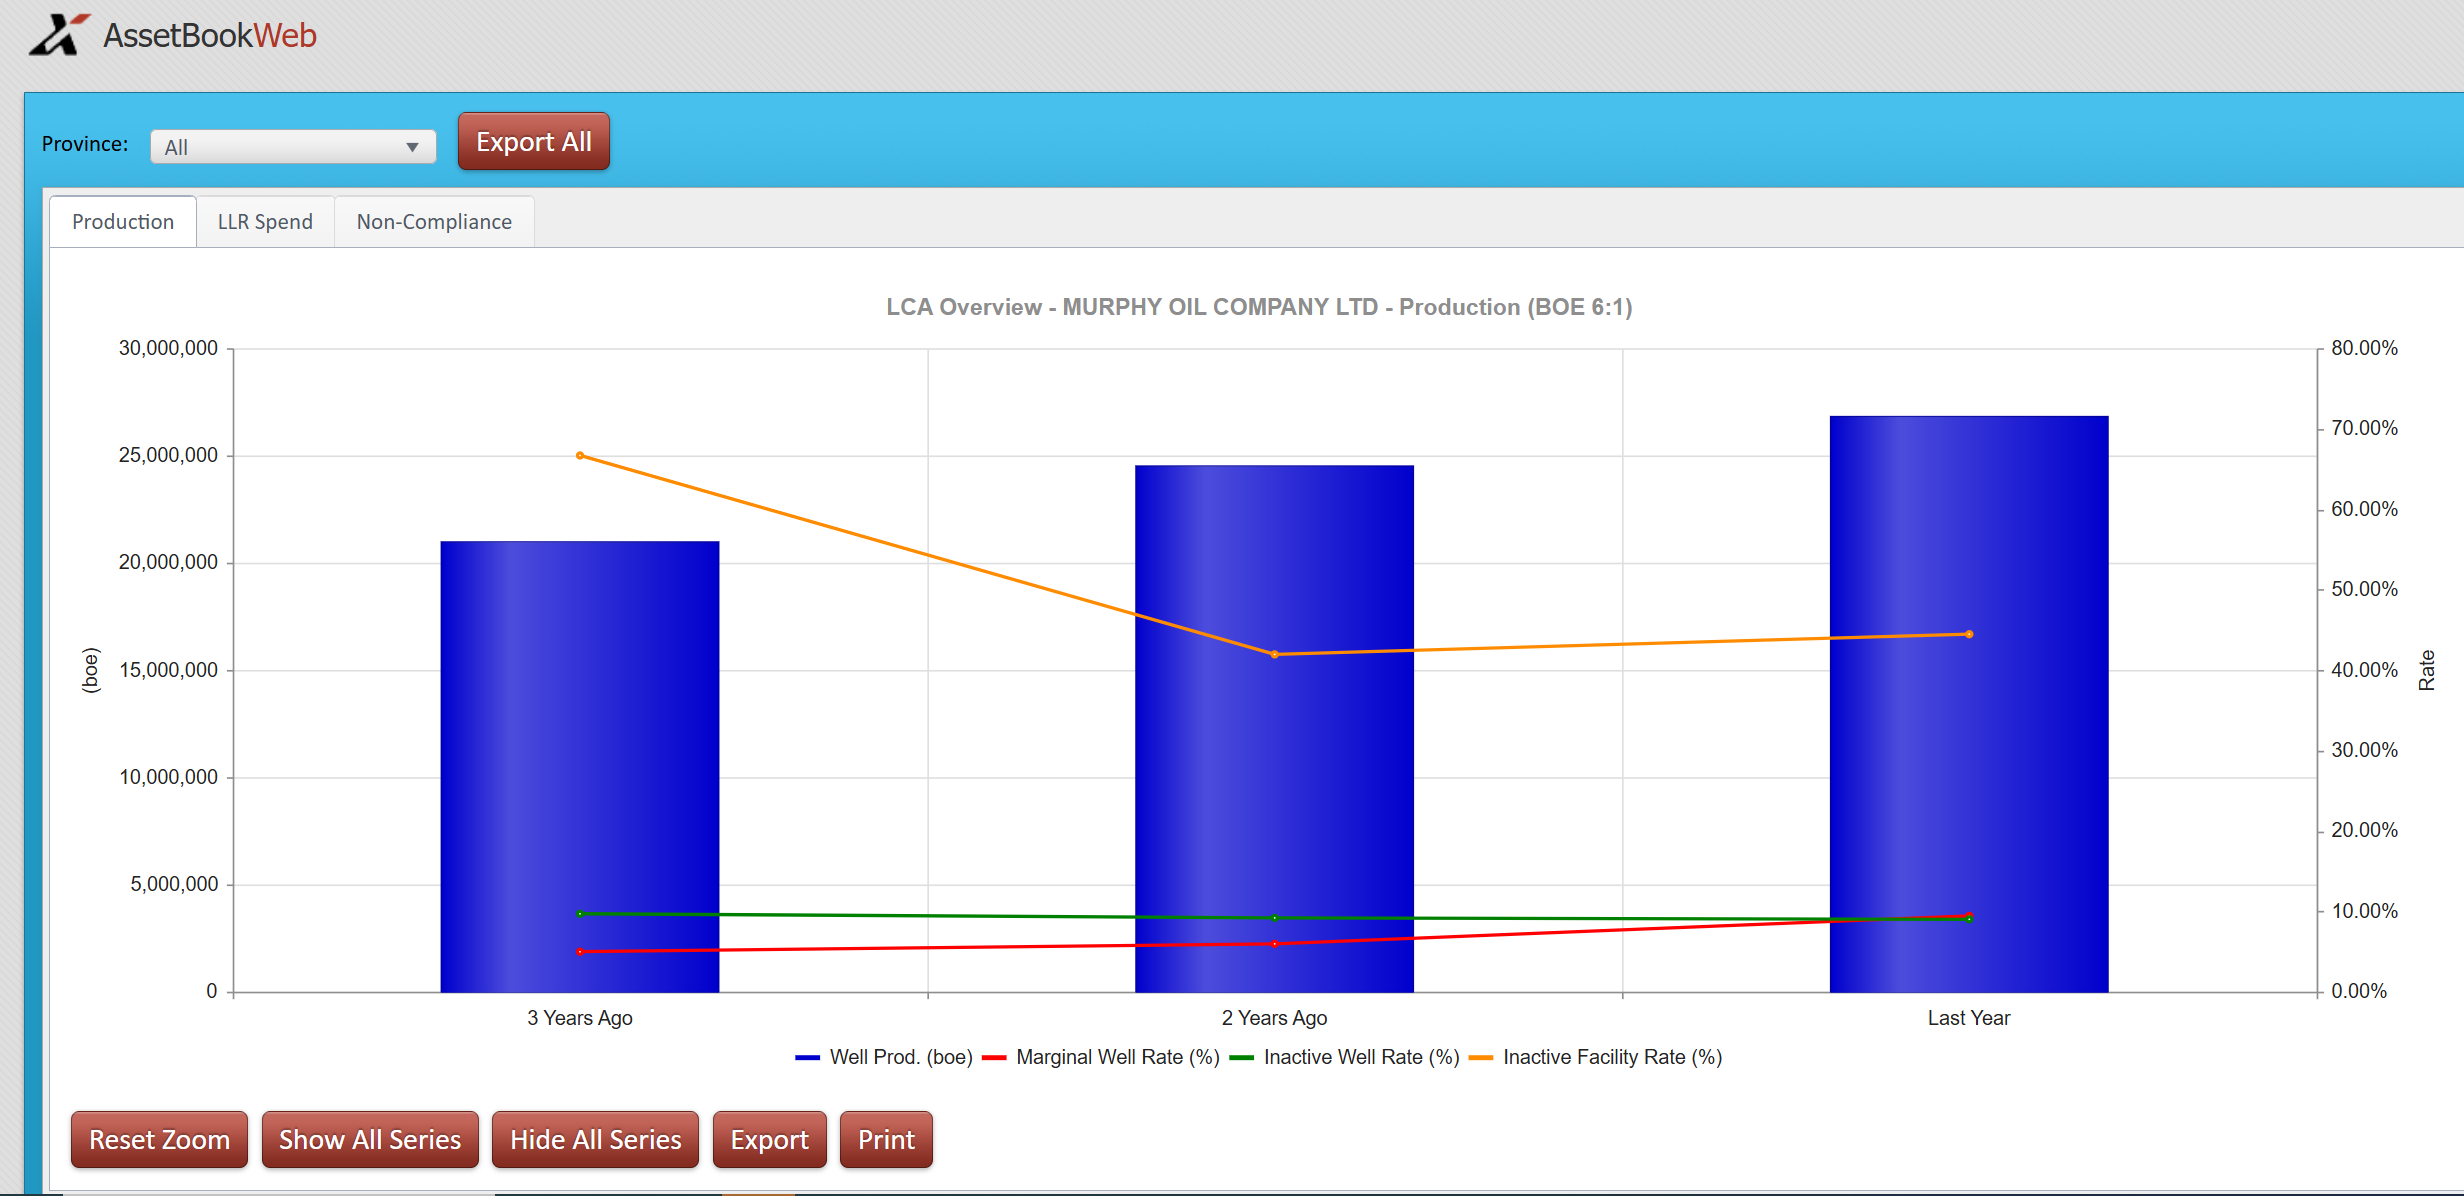
AssetBook LLR/LCA Analysis
Our Module for determining the Licensee Capability Assessment (LCA) helps eliminate the “black box” of AER regulations:
- Make good business decisions by evaluating holistically with more transparency: LCA helps you get a sense of likely regulatory approval for potential acquisitions.
- Comparison of all companies allows for easy benchmarking and compliance.
- XI uses AER’s format to determine health of company based on historical performance. This helps with strategic planning, financial forecasting and risk management.
See for yourself! Request a FREE sample LCA Report for companies in your core area.
Upcoming Certification Course:
ARO Manager For Financial Tracking and Reporting Certification Course provides practical, hands-on professional development for anyone interested in expanding their knowledge of Asset Retirement Obligation (ARO) tracking and reporting.
When: December 10th and December 12th at 8:30am (almost full)
When: February 25th and February 27th at 9:00am
Space is limited so be sure to register now for the course. This is 2 x half- day course taking place in person at the XI office.
Office move/support holiday season hour info:
- December 6, 2024 – Office will be closed for the day for our staff Christmas Party.
- December 20, 2024 to January 2, 2025 – Office closed for the holidays and for our office move!
We’re Moving! New Location in 2025:
XI Technologies Inc.
2400 – 500 4th Avenue SW (Altius Centre)
Calgary, Alberta T2P 2V6
Each week, XI Technologies uncovers trends and insights using our enhanced data and software focused on the WCSB. If you’d like Word to the Wise delivered directly to your inbox, subscribe here. For more tips and to learn about how XI’s AssetSuite can help with your high-level analysis visit XI’s website or contact XI for a demo.
Ovintiv Inc (Ovintiv) has announced that it is acquiring Paramount Resources Ltd (Paramount) assets for $3,325 billion. Last year, Tourmaline acquired Bonavista for $1.45 billion, which, based on AssetBook’s 6:1 ratio, translated to a valuation of about $30,400 per barrel of oil equivalent per day (boe/d). Later that year they purchased, which Tourmaline’s estimated the production at 29,000 to 30,000 boe/d with valuation of approximately $44,000 per boe/d. Ovintiv estimates this deal to provide approximately 70,000 boe/day to their production putting the boe/day price at about $47,000.
XI Technologies evaluated this transaction through different lenses using AssetSuite software tools and looked at each company’s asset profile, plus the combined entity, to gain valuable insight into the transaction. Consideration was also given to the fall out and which other players in the area may be affected. This deep dive gives a comprehensive understanding and full picture of the resulting acquisition.
The best way to see the core of this deal is to overlay the production heat map of Paramount’s Montney wells over Ovintiv production.
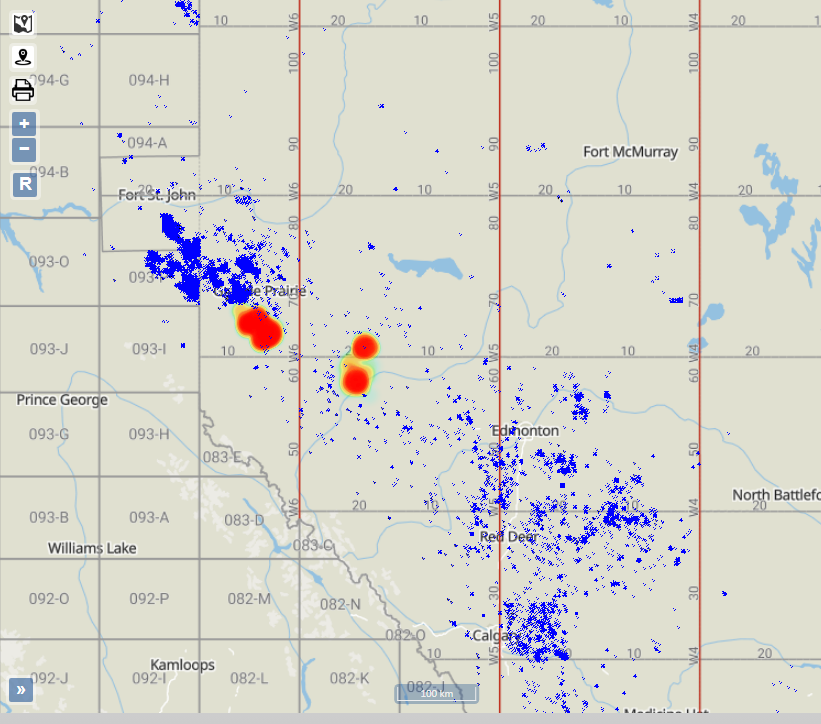
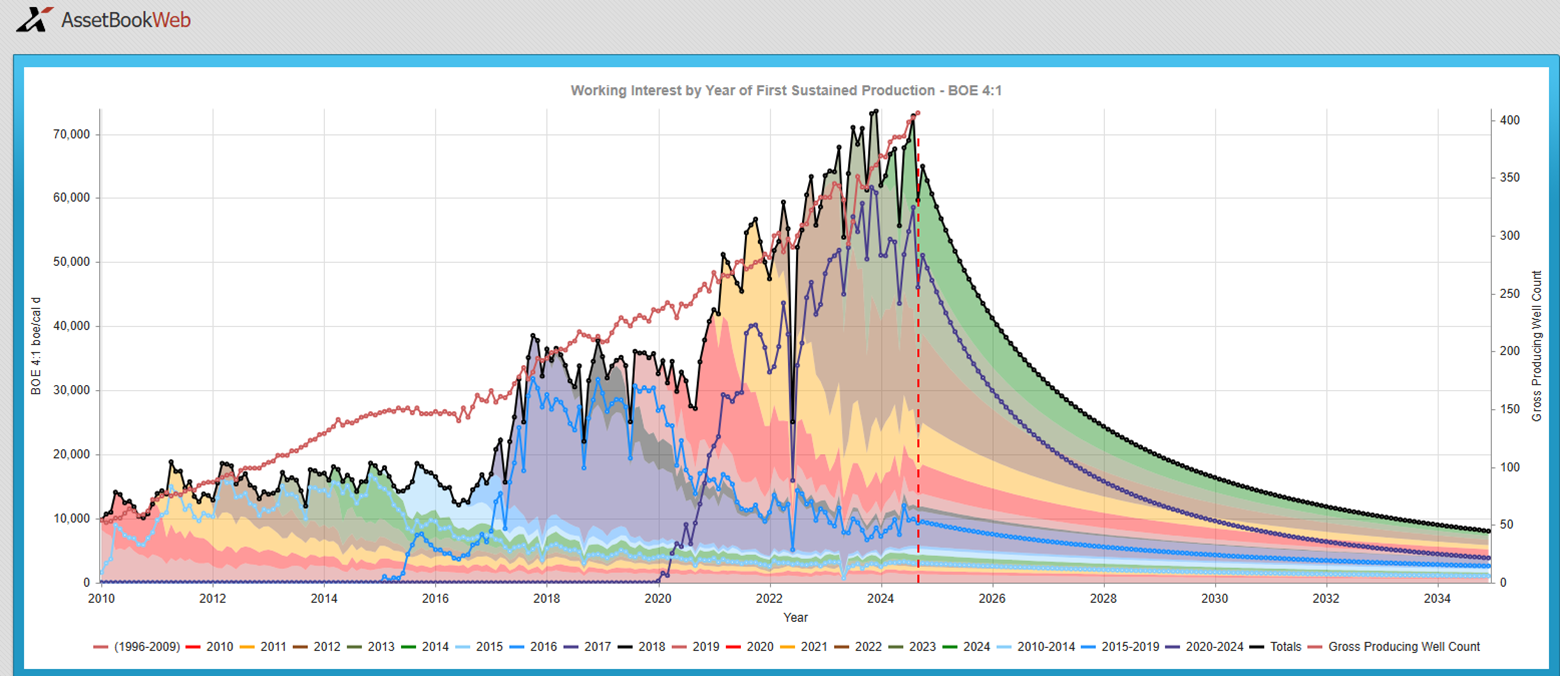
Looking at this map, there are two areas of Montney production for Paramount with only one of the two areas referenced in their press release; the one just south of Grande Prairie. This acquisition is a Montney asset purchase which is liquid rich and relatively new as shown in the production time slice graph below.
A CORE AREA OVERVIEW
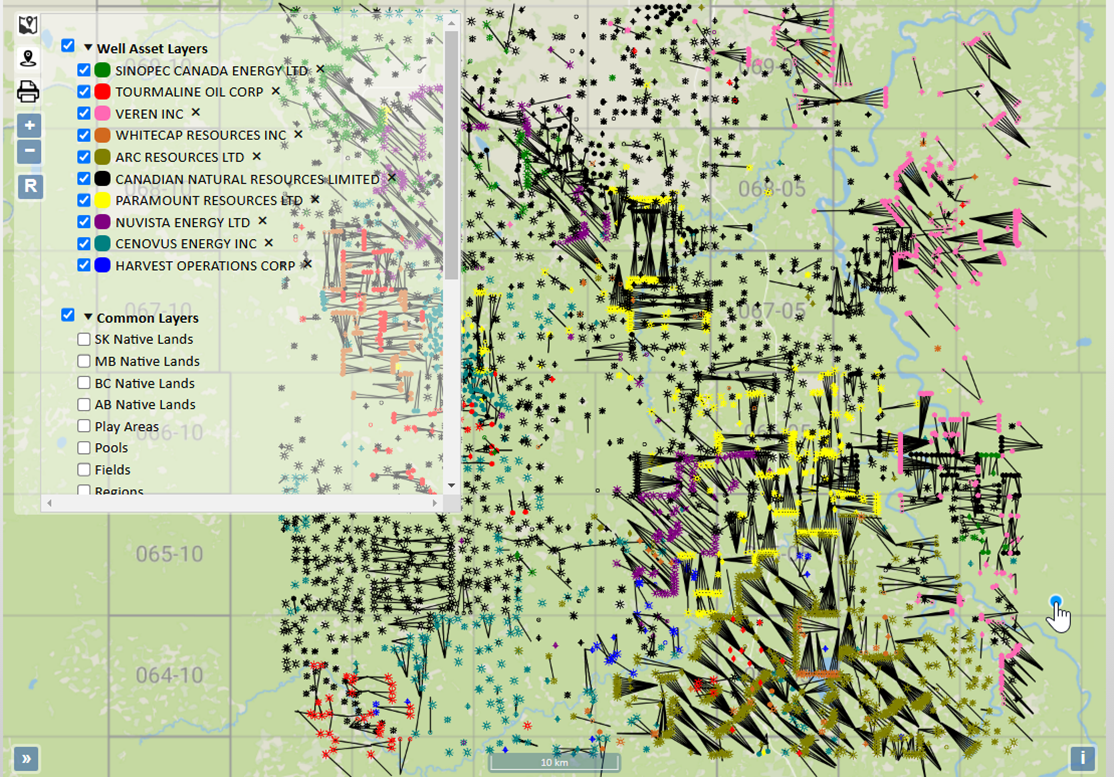
With the AssetBook we can create a rough area around where Paramount’s Grande Prairie Montney assets fall and see all other players in that region. Arc Resources Ltd is the largest player in this area with approximately 34k boe/d or 24% of the total area (Source: AssetBook, using a 6:1 boe rate). The area has 48 producers and 80% of the production is held by the top 5 producers.
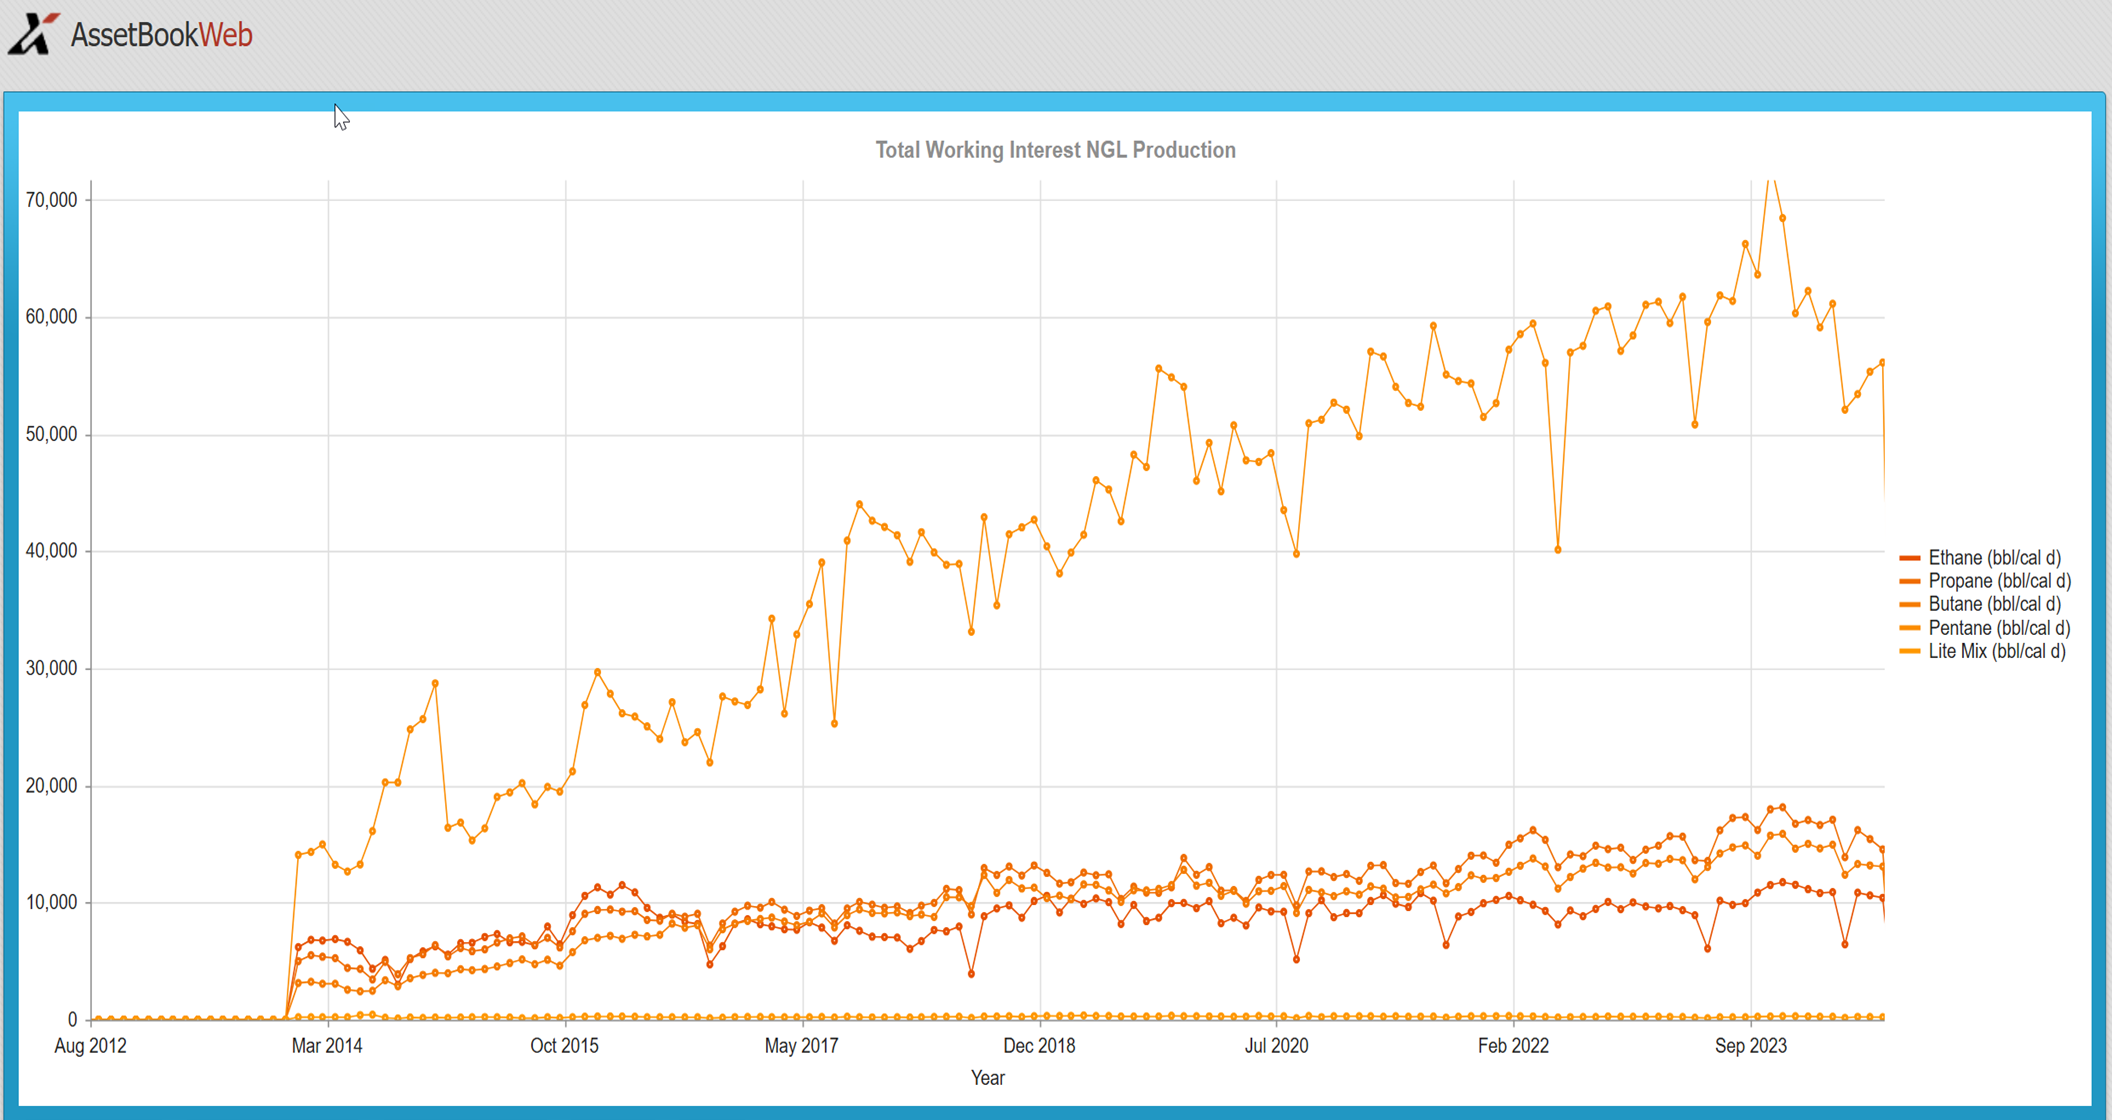
This is primarily a gas producing area with a little more than 74% of the production coming from gas. This area is Natural Gas Liquid rich. To see a breakdown of companies in this area including their NGL production please click here.
We can also graph the NGL production over time in this area and see that it is steadily increasing:
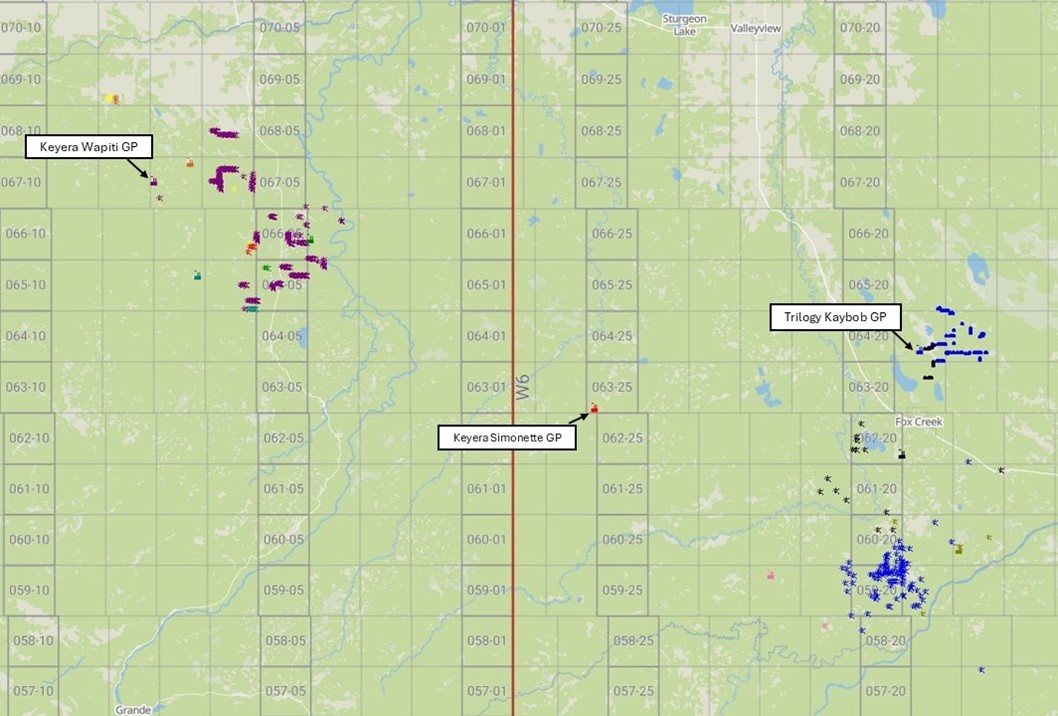
Where does Paramount Montney Gas and NGL production go for Processing?
Using XI’s newest Production Chain feature, we can instantly see where Paramount’s Montney assets are likely going for processing and to market. We’ll focus on gas processing, as most produced oil here leaves for refining via transport from multiwell batteries (a particularly large crude multiwell proration battery is Paramount’s Para Kaybob which sits adjacent to Paramount’s Trilogy Kaybob Gas Plant).
In our estimation, the majority of the gas and NGLs are processed at two plants, Paramount’s Trilogy Kaybob Gas Plant, and Keyera’s Wapiti Gas Plant. It has not been disclosed if Paramount’s Trilogy plant is part of the acquisition. Interestingly, the entirety of the active well inventory (210 wells) at Keyera’s Wapiti plant appear to belong to Paramount Resources.
If you’d like to learn more about these assets, or have a demo of our newest Production Chain feature that traces the molecule from well to facility market point, please contact XI at [email protected].
While analyzing deals after they are announced is interesting, XI’s tools are uniquely positioned to provide advanced information for proactive scoping. This allows you to look at your own deals in the works and mitigate potential risks or find new deals that offer better value.
The evolving landscape of emissions regulations in the oil and gas sector demands a nuanced understanding of individual company efforts. As we move towards a sustainable future, dissecting these graphs and exploring the underlying dynamics becomes crucial in shaping effective regulatory frameworks and industry practices.
Here’s how YOU can prepare: Join our “Expert Xchange” on Emissions presented by GLJ and XI Technologies.
- What: Learn more about the mandates affecting Alberta’s oil & gas sector, what’s coming, how you’ll be expected to track and report on your own emissions, and how you can manage the process related to M&A activities and line of sight planning.
- Where: XI Technologies – 1700, 734-7th Ave SW Calgary T2P 3P8
- When: Dec. 3 @ 8:15am
- How: This is a live event & space is limited – Register HERE
Upcoming Certification Course:
ARO Manager For Financial Tracking and Reporting Certification Course provides practical, hands-on professional development for anyone interested in expanding their knowledge of Asset Retirement Obligation (ARO) tracking and reporting.
When: December 10th and December 12th at 8:30am (almost full)
When: February 25th and February 27th at 9:00am
Space is limited so be sure to register now for the course. This is 2 x half- day course taking place in person at the XI office.
Each week, XI Technologies uncovers trends and insights using our enhanced data and software focused on the WCSB. If you’d like Word to the Wise delivered directly to your inbox, subscribe here. For more tips and to learn about how XI’s AssetSuite can help with your high-level analysis visit XI’s website or contact XI for a demo.
The oil and gas sector continues to be a focal point in the global conversation on climate change, and governments are taking additional steps to regulate and reduce emissions. Recent news about the emissions production cap (equivalent to 35 percent below 2019 levels) announced by the Government of Canada last week is controversial. Our industry has weathered many changes in regulations over the decades through perseverance and our entrepreneurial spirit. While this news can seem like one more straw that will eventually break the camel’s back, a holistic view based on data can provide insight and a path forward. At XI, we have built our business on government data and on helping our clients navigate regulations and are pleased to provide an article originally published in January 2024, updated for currency.
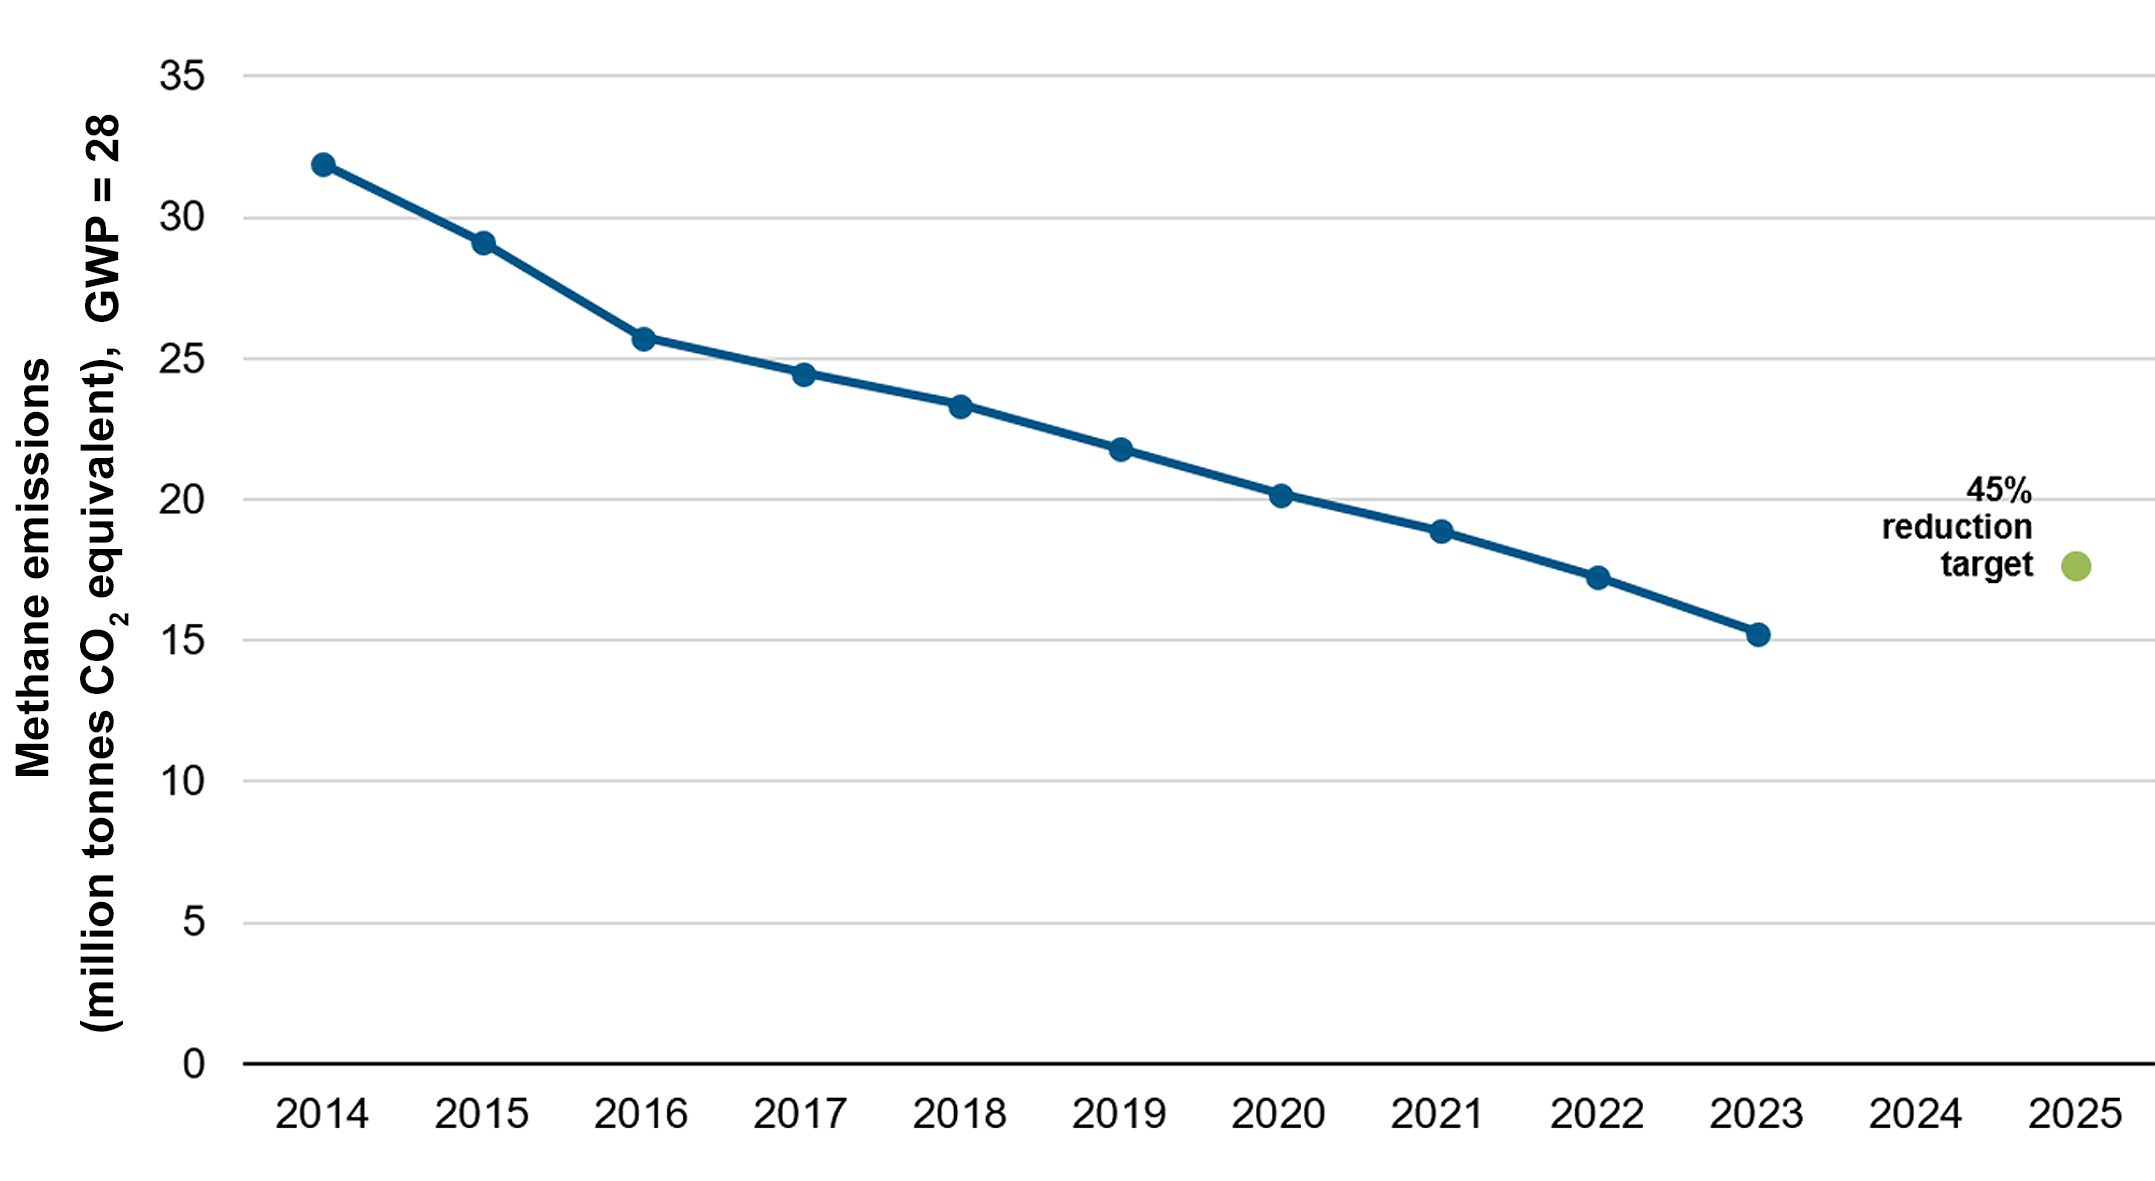
In early January 2024, the AER published their updated Methane-Emissions package, including an updated Upstream Petroleum Industry Emissions Report (ST-60B). The report is a summary of performance updated in November 2024 to include 2023 data, breaking down fuel, flare, vent, and fugitive emissions (including source specific emissions). Accompanying the report, the Methane Performance report brought attention to this fact:
Alberta has achieved the Government’s goal of a 45% reduction in methane emissions from the 2014 baseline, reaching this milestone two years ahead of the 2025 deadline.
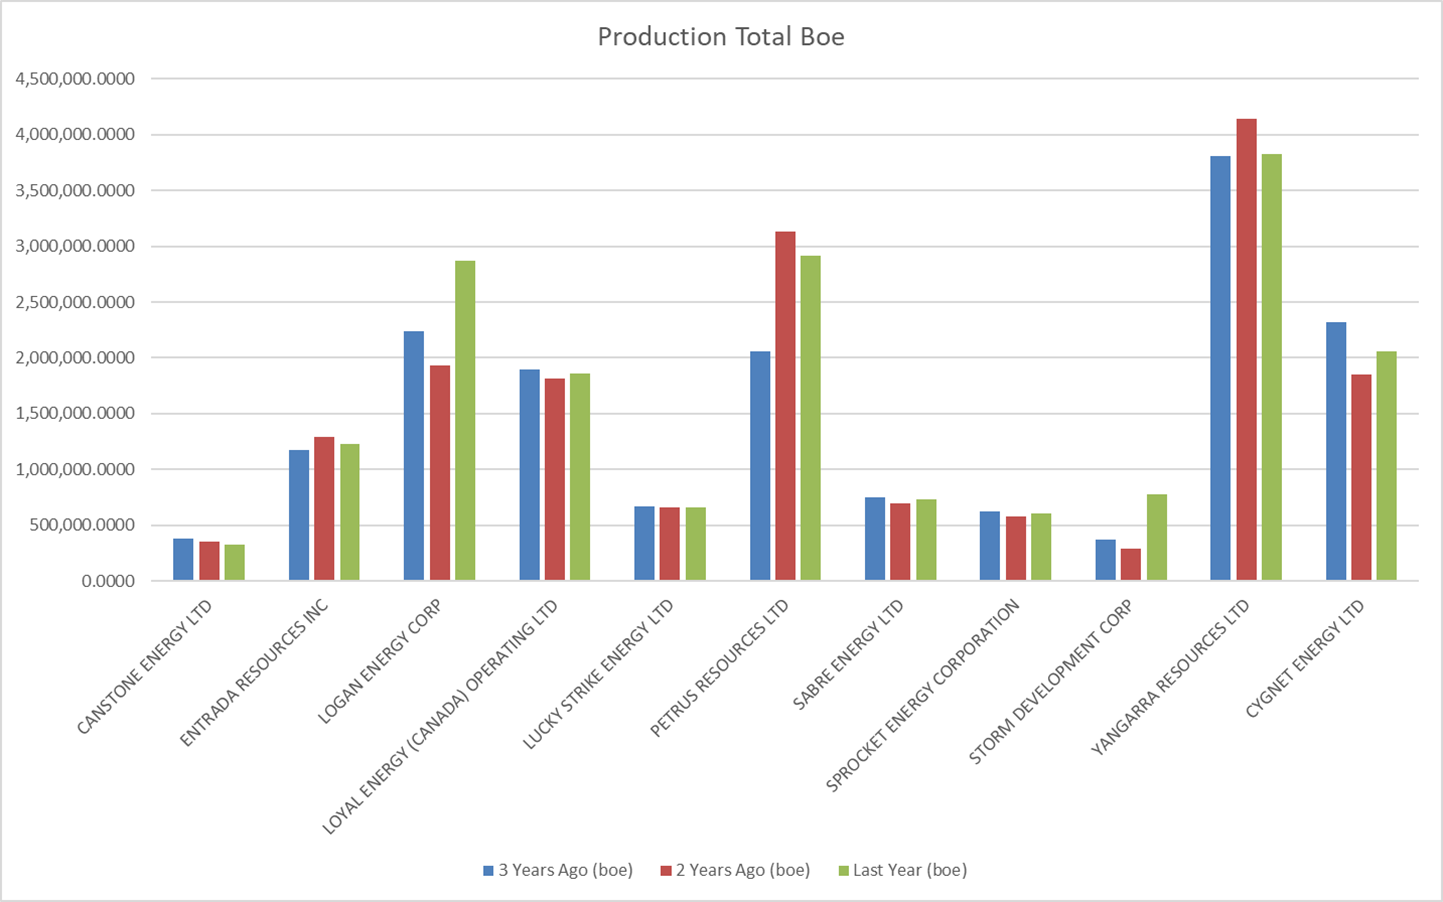
The latest AER reporting is current to 2023. How are individual companies in Alberta currently responding to these mandates? Let’s delve into the emissions trends over the last three years, plus add in Year to Date (YTD) metrics, with a focus on intermediate peer group companies.
The following graphs were generated from XI Technologies AssetBook Emissions Module that can be used to view Scope 1 emissions data for any asset in the WCSB. Peer Groups were generated from our Licensee Capability Assessment (LCA) Module, focusing on AER’s Directive 88: Licensee Life-Cycle Management directive. In addition to 2023 totals, the charts include 2024 YTD totals.
Unveiling the Data: Alberta’s Emissions Landscape
Three distinct graphs, representing intermediate peer group companies, shed light on the reported Scope 1 emissions (fuel, flare, vent) and production trends in Alberta’s oil and gas sector. These companies are categorized based on their size and primary product type, following the guidelines outlined in Directive 88. The trends are based on an operator’s current asset holdings (as of Nov 2024), with a look back at how they have performed over time.
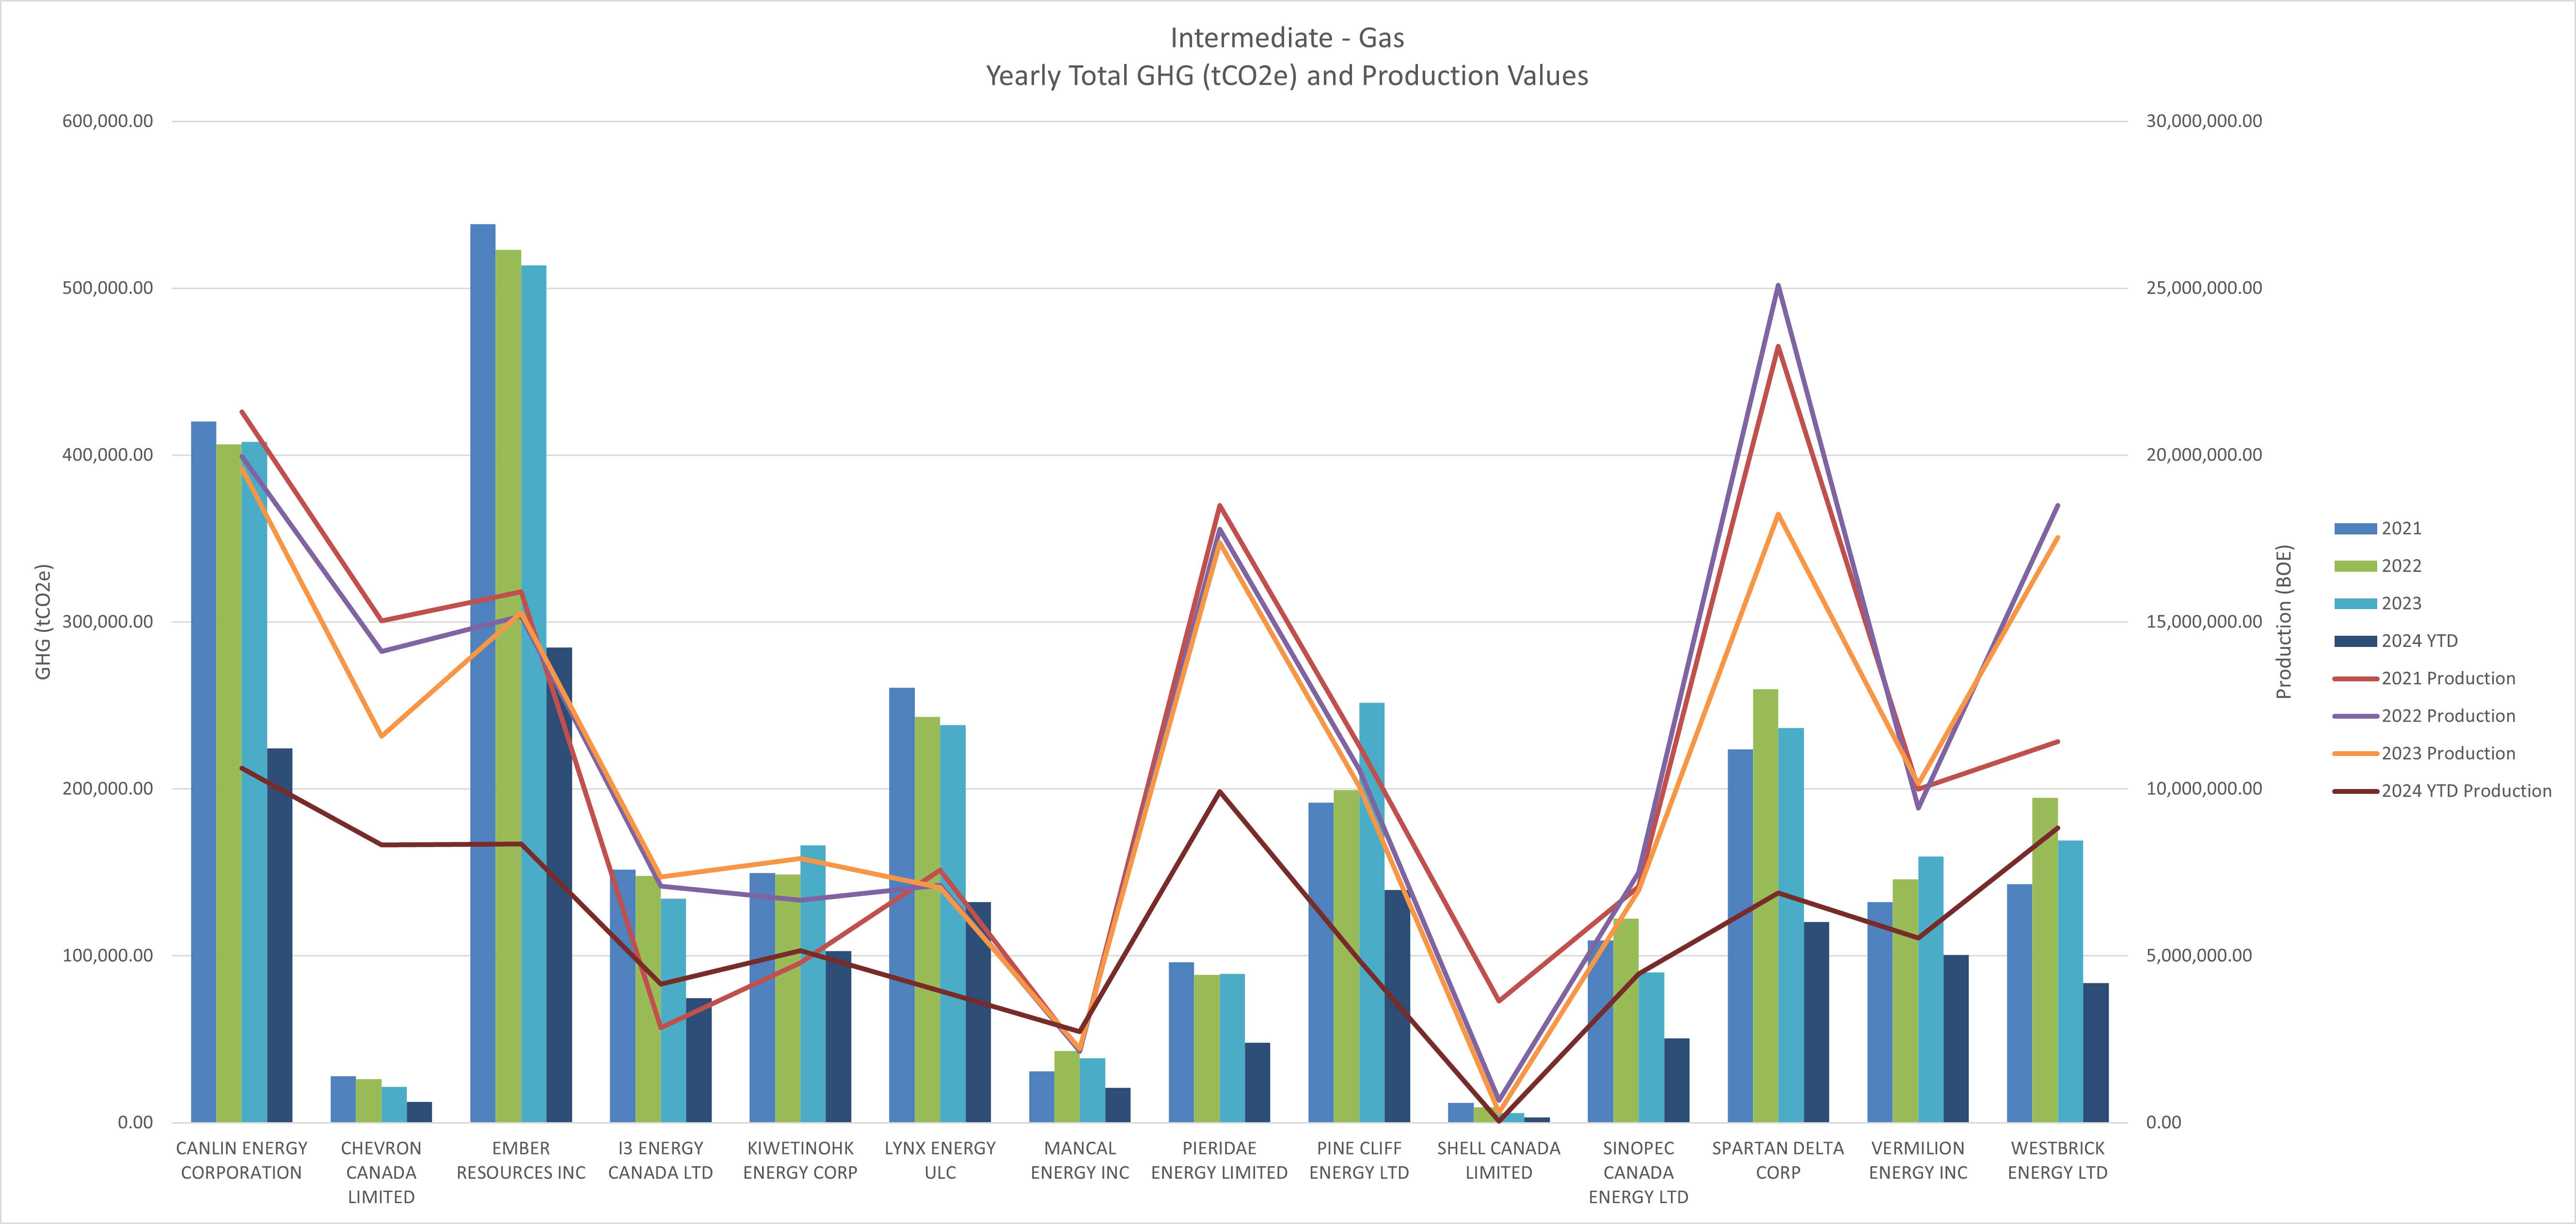
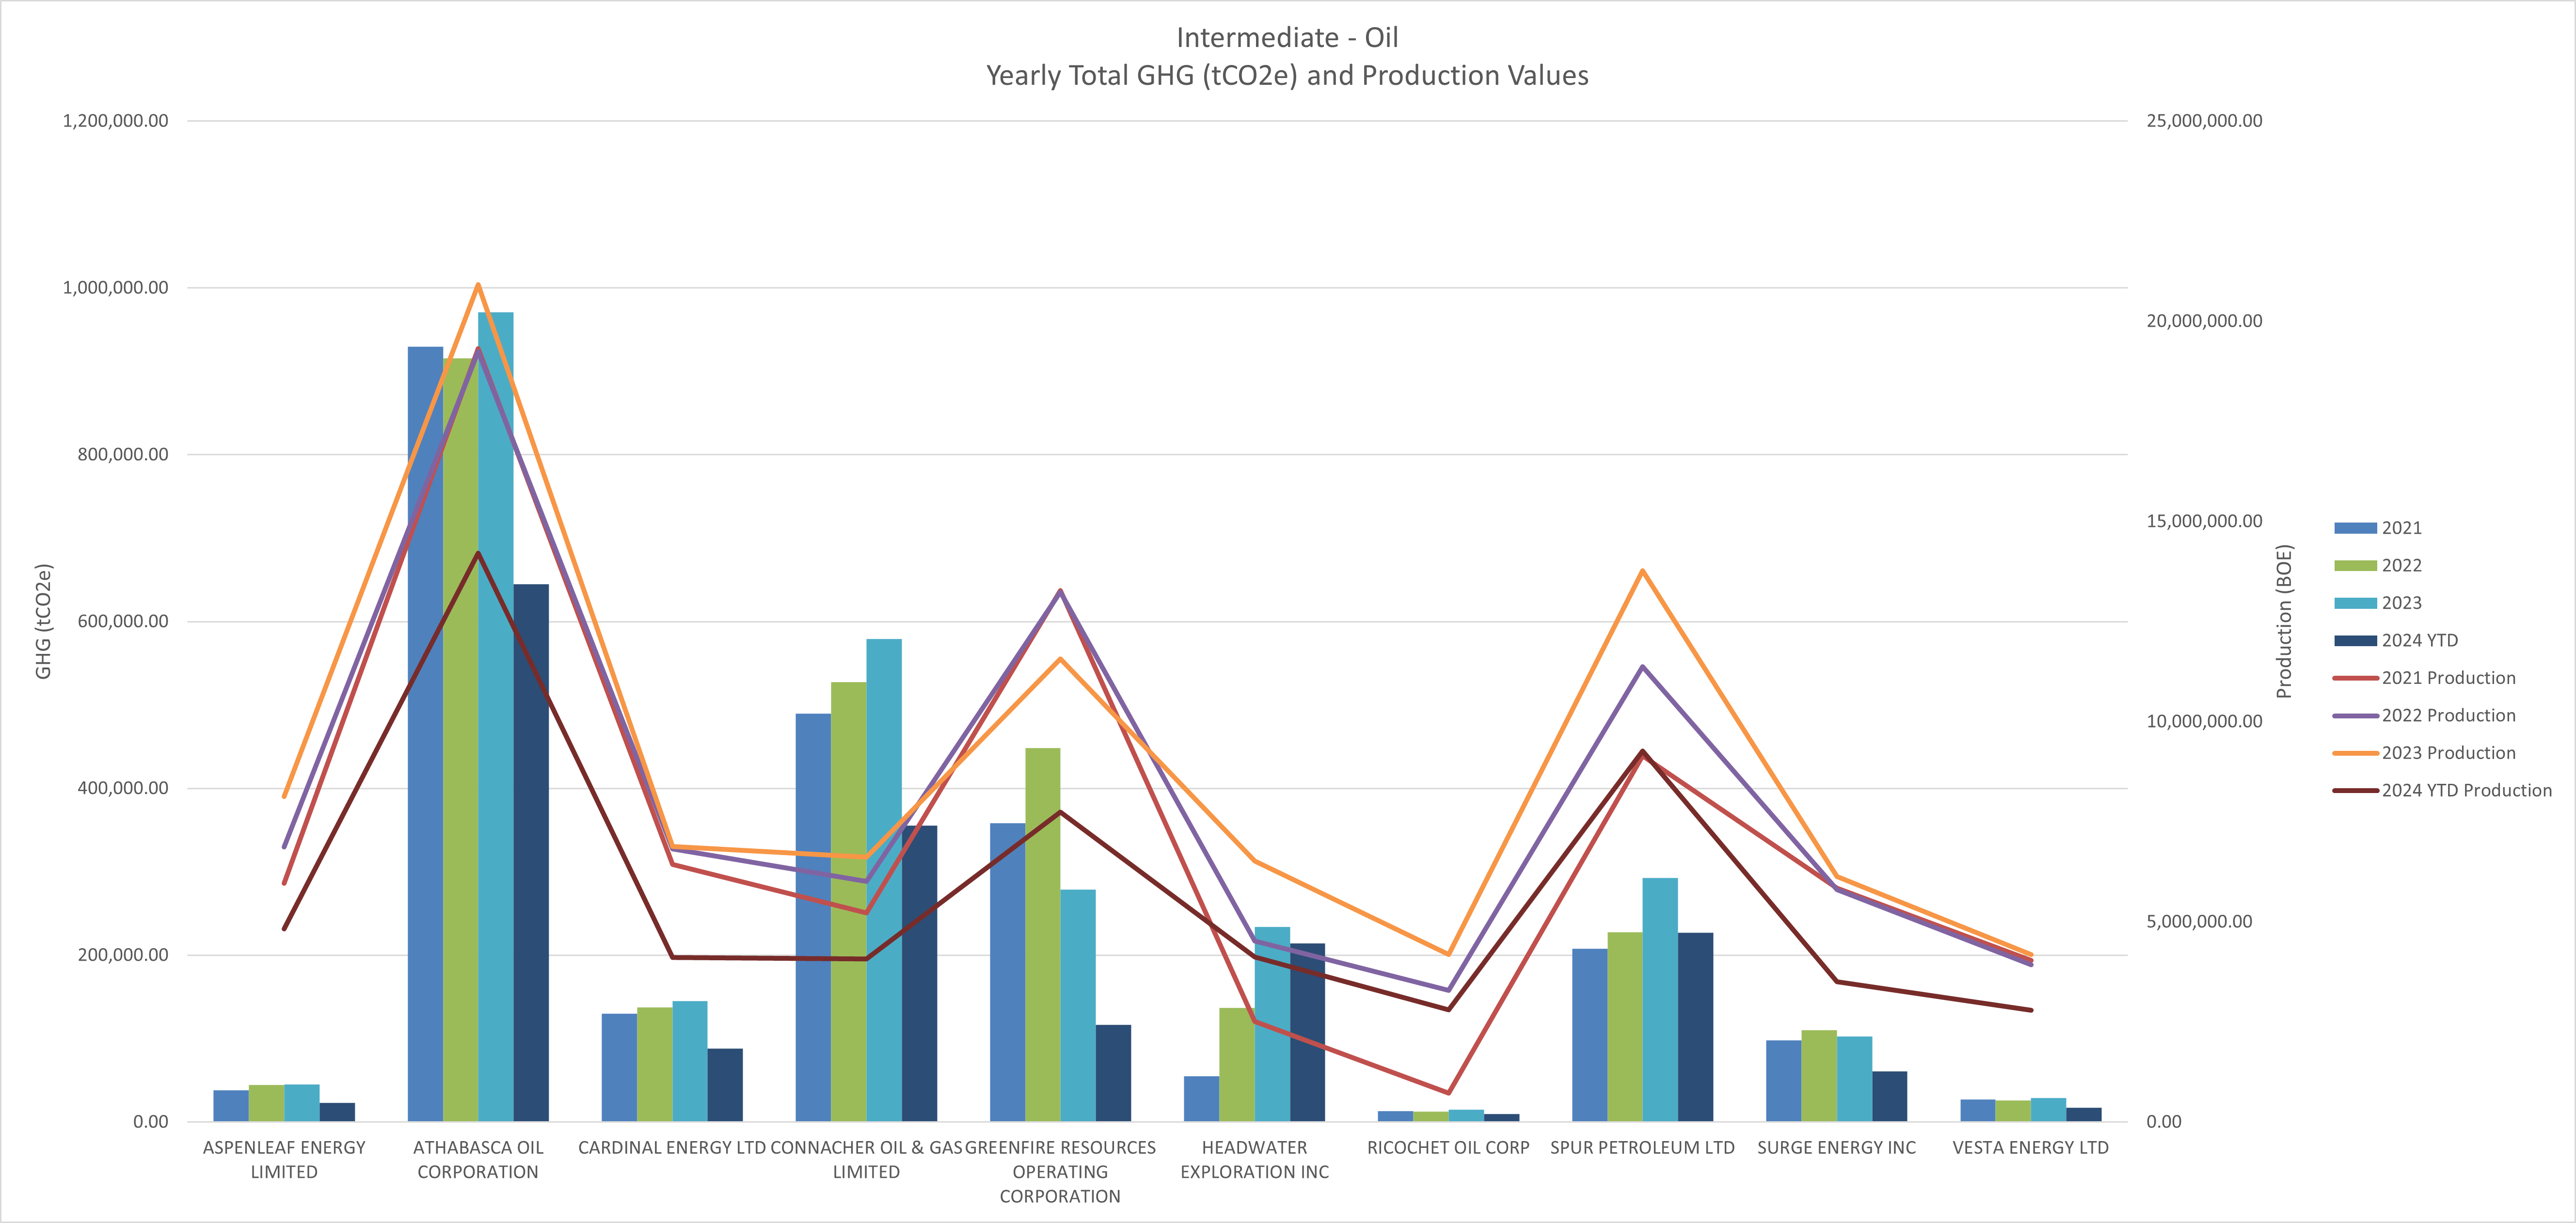
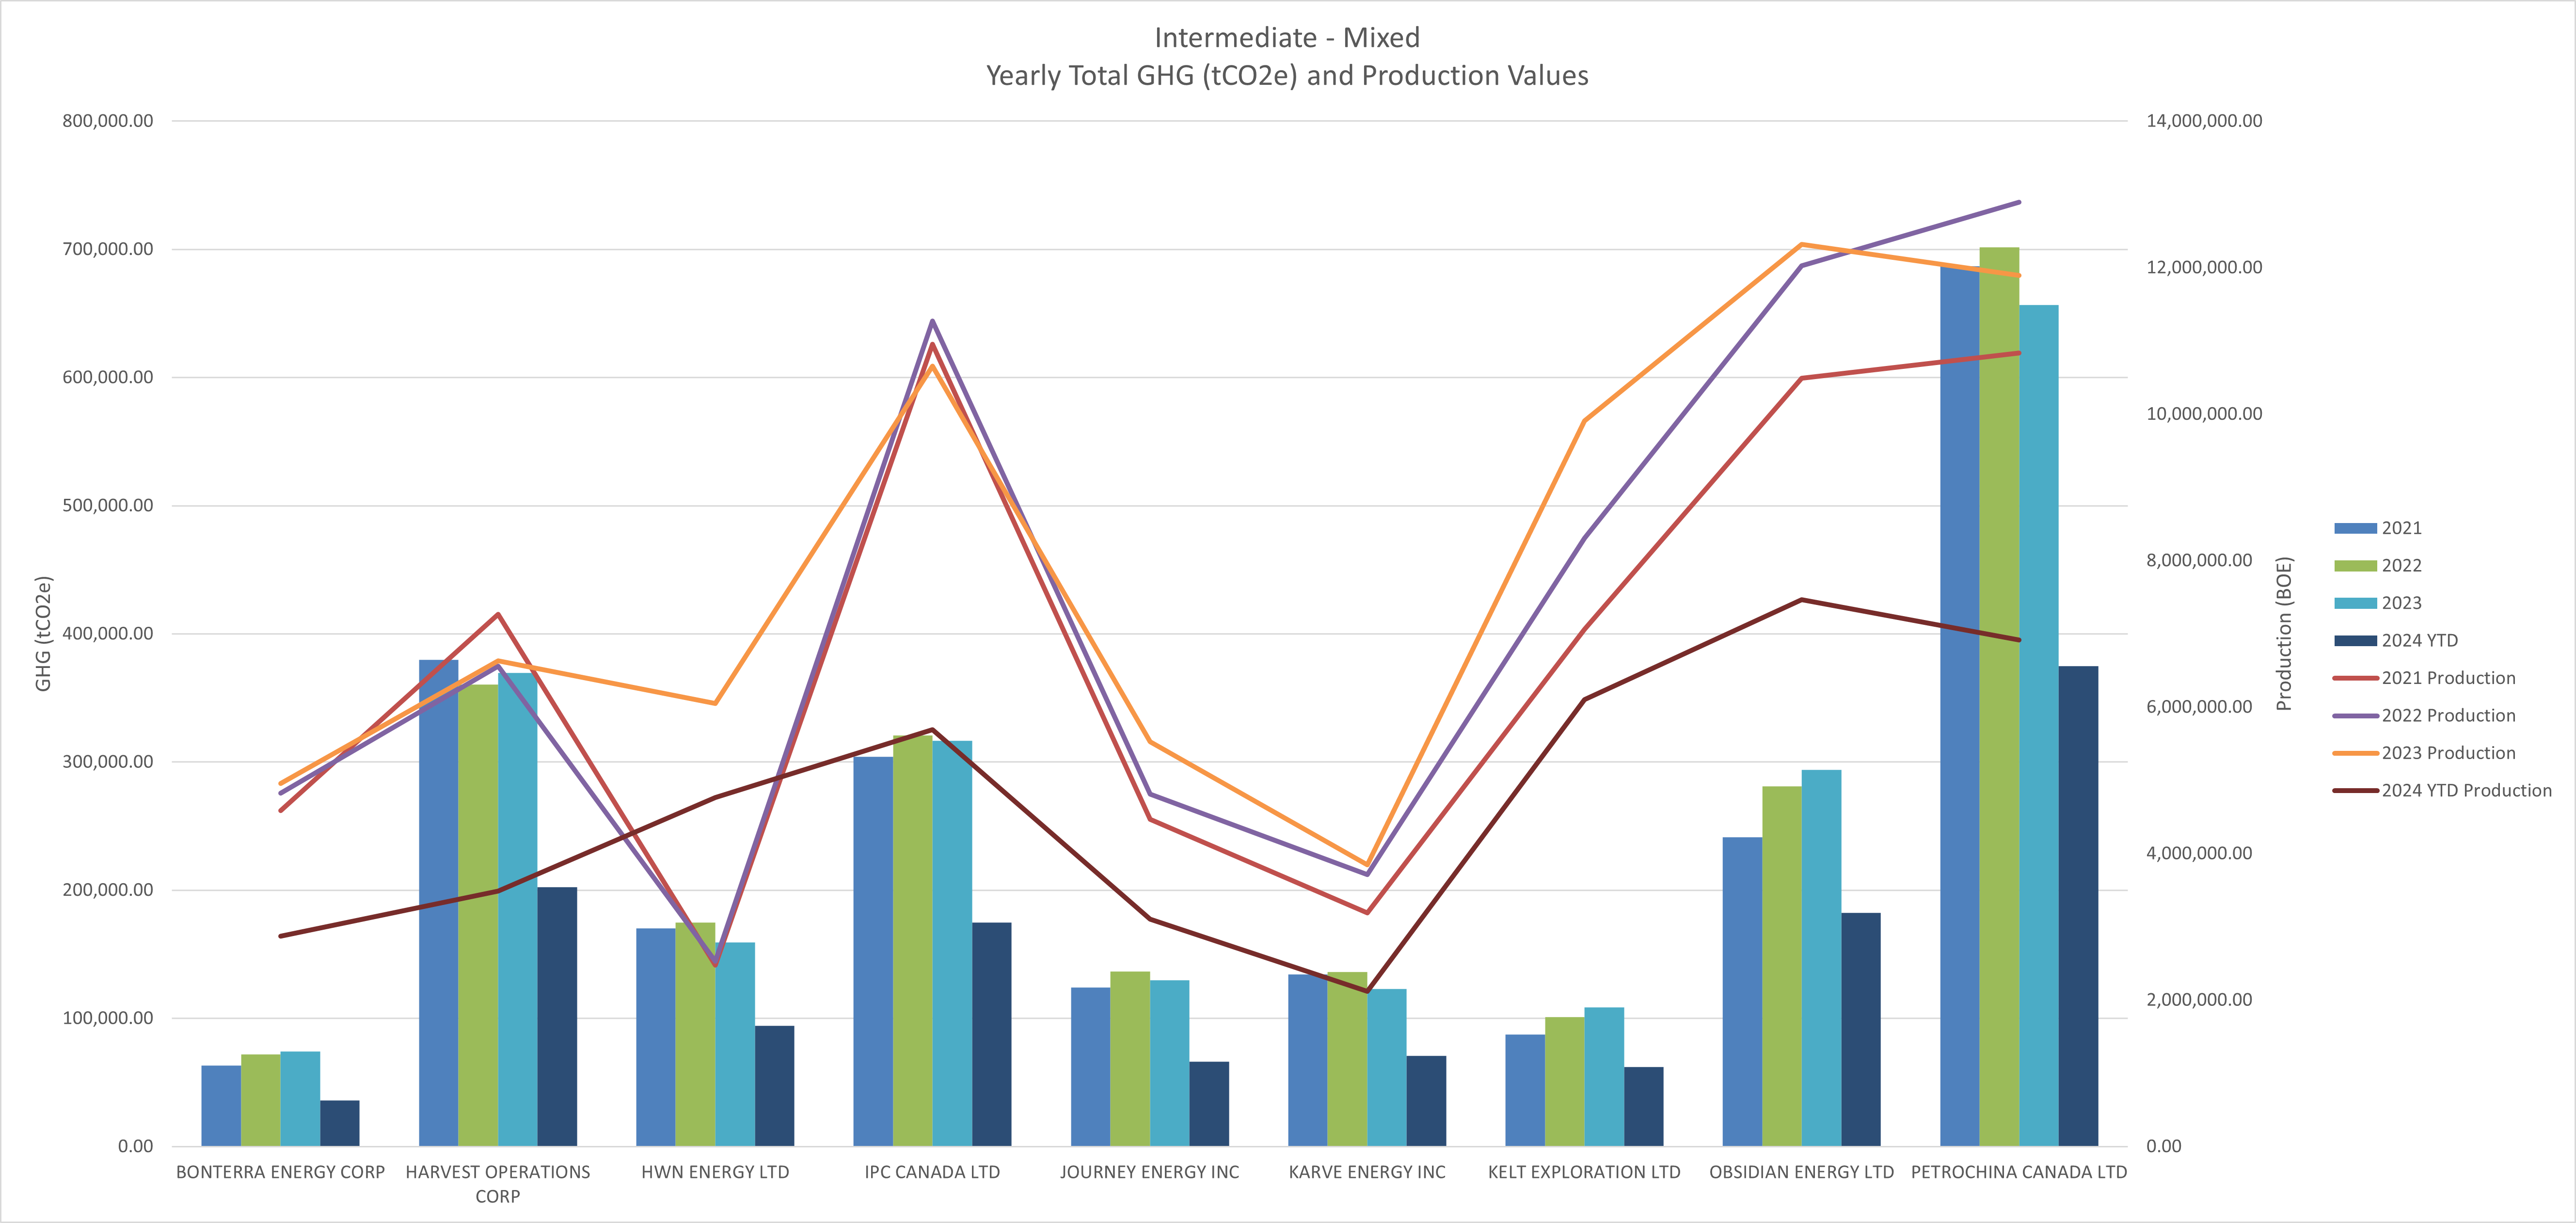
Puzzling Disparities: Efficiency or Selective Operations?
A notable observation is the presence of companies with significantly higher production relative to their reported emissions. This raises intriguing questions – are these companies operating more efficiently, or are they not operating their higher emitting facilities?
Understanding the nuances behind these disparities can offer valuable insights into best practices within the industry. It might signify innovative approaches to emissions reduction or indicate areas where operational efficiencies can be replicated across the sector.
The Road Ahead: AssetBook Emissions Analysis
Another change is coming via the Canadian Sustainability Standards Board (CSSB) as it follows international protocol already in action elsewhere. The new rules enforce mandatory sustainability and emissions disclosures for all Canadian companies. You can learn more about this here.
CSDS 1 and 2 largely align with IFRS S1 and S2, but contain some recommended Canadian-specific modifications, which include:
- Extending the earliest voluntary adoption dates for CSDS 1 and CSDS 2 from January 1, 2024, to January 1, 2025.
- The proposed transition relief for disclosures beyond climate-related risks and opportunities has been extended from one year granted by the ISSB to two years. This means entities that voluntarily adopt the CSSB standards on January 1, 2025, will be required to disclose information on all sustainability-related risks and opportunities from the reporting period beginning on or after January 1, 2027.
- The proposed transition relief for disclosure of Scope 3 GHG emissions has been extended from one year granted by the ISSB to two years. This means entities that voluntarily adopt the CSSB on January 1, 2025, will be required to disclose Scope 3 GHG emissions from the reporting period beginning on or after January 1, 2027.
Whether it’s through new government announcements about the pending emissions cap, or imminent disclosure requirements heading our way, one thing is clear: emissions reporting is no longer optional, nor can it be left to each company’s self-reporting methodology.
For those keen on exploring this analysis in greater detail or examining different peer groups, AssetSuite offers a comprehensive solution. Whether you desire a deeper dive into the data or wish to explore trends, a demo of AssetBook Emissions could provide the answers you seek.
The evolving landscape of emissions regulations in the oil and gas sector demands a nuanced understanding of individual company efforts. As we move towards a sustainable future, dissecting these graphs and exploring the underlying dynamics becomes crucial in shaping effective regulatory frameworks and industry practices.
Here’s how YOU can prepare: Join our “Expert Xchange” on Emissions presented by GLJ and XI Technologies.
- What: Learn more about the mandates affecting Alberta’s oil & gas sector, what’s coming, how you’ll be expected to track and report on your own emissions, and how you can manage the process related to M&A activities and line of sight planning.
- Where: XI Technologies – 1700, 734-7th Ave SW Calgary T2P 3P8
- When: Dec. 3 @ 8:15am
- How: This is a live event & space is limited – Register HERE
Upcoming Certification Course:
ARO Manager For Financial Tracking and Reporting Certification Course provides practical, hands-on professional development for anyone interested in expanding their knowledge of Asset Retirement Obligation (ARO) tracking and reporting.
When: December 10th and December 12th at 8:30am (almost full)
When: February 25th and February 27th at 9:00am
Space is limited so be sure to register now for the course. This is 2 x half- day course taking place in person at the XI office.
Each week, XI Technologies uncovers trends and insights using our enhanced data and software focused on the WCSB. If you’d like Word to the Wise delivered directly to your inbox, subscribe here. For more tips and to learn about how XI’s AssetSuite can help with your high-level analysis visit XI’s website or contact XI for a demo.
Recent government directive changes are posing potential challenges for companies managing their Asset Retirement Obligations (ARO) through traditional spreadsheets. In particular, the Alberta Energy Regulator (AER) revised Directive 011 in June for greater accuracy of liability cost estimates related to well abandonments under the new Liability Management Framework (for an overview, see our previous article – Unpacking Directive 011: What You Need To Know).
While these updates aim to enhance accountability and transparency, they also introduce complexities that can lead to inaccuracies and broken spreadsheet formulas. If your organization is still relying on spreadsheets for ARO management, you may find that this method falls short in addressing the intricacies of the new requirements.
ARO planning, tracking and reporting can be daunting, especially when changes to costs disrupt traditional spreadsheet-based cost models. With numerous cells affected by one data point, these manual changes in a spreadsheet may lead to inaccuracies and inefficiencies in your financial tracking and forecasts, affecting risk-related decisions.
XI Technologies created the industry-leading solution in ARO Manager, a more robust and stable database software designed to adapt seamlessly to directive shifts while keeping your cost model intact, ensuring precise calculations for your future planning.
Efficient ARO management is crucial for maintaining financial health and compliance. While spreadsheets have been a go-to tool for many organizations, the recent webinar by XI Technologies, “The Problem with Spreadsheets,” sheds light on the growing challenges associated with relying on spreadsheets for ARO management. Here’s a breakdown of the key insights from the webinar and why it’s time to consider a more robust solution.
What is Asset Retirement Obligation (ARO)
Asset Retirement Obligation (ARO) is an accounting term utilized across various industries. For the oil and gas sector, it refers to the costs associated with the abandonment and reclamation of wells and facilities, including pipelines. The significance of ARO has grown increasingly critical in recent years, especially in relation to Directive 88 of the Alberta Energy Regulator (AER), which focuses on Licensee Life-Cycle Management (LCM). ARO and LCM have become central to discussions in the industry.
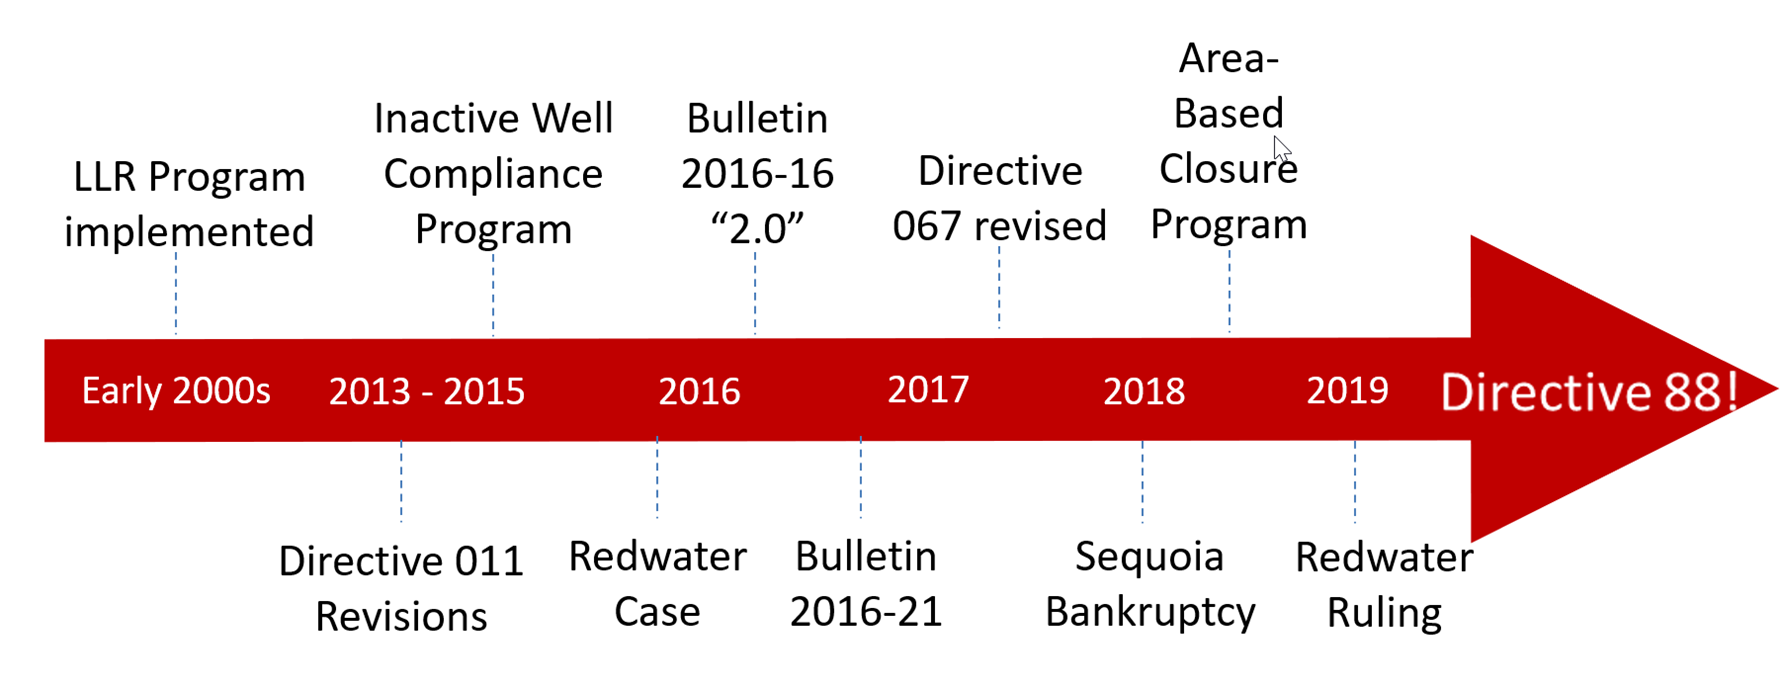
Key Events in Liability Management
Why is ARO Important
Asset Retirement Obligation (ARO) is critical to the oil and gas industry for several reasons. First and foremost, accurate ARO financial tracking and reporting ensures that companies properly account for the future costs associated with decommissioning wells and restoring sites to their natural state. This financial planning is essential to avoid unexpected liabilities that could impact a company’s profitability and sustainability.
Furthermore, ARO plays a significant role in regulatory compliance. With increasing scrutiny from regulators and stakeholders, companies are required to demonstrate their commitment to environmental stewardship and responsible resource management. Properly accounting for ARO helps ensure that operators fulfill their legal obligations and adhere to industry standards, particularly under frameworks like Directive 88 from the Alberta Energy Regulator.
Additionally, ARO contributes to risk management. By accurately estimating the costs and timelines for abandonment and reclamation, companies can better prepare for potential challenges, reducing the risk of financial and reputational damage. This proactive approach fosters trust among investors, communities, and regulatory bodies, ultimately supporting a company’s long-term viability.
Finally, as the industry shifts toward more sustainable practices, ARO is integral to transitioning away from traditional extraction methods. It encourages companies to consider the full lifecycle of their operations, promoting practices that mitigate environmental impact and enhance social responsibility. In summary, accurate ARO tracking is vital not only for financial stability and compliance but also for fostering a culture of accountability and sustainability in the oil and gas sector.
Spreadsheets: A Double-Edged Sword
Spreadsheets have long been popular due to their flexibility and ease of use. They allow users to quickly input data, perform calculations, and generate reports. For many organizations, this convenience makes spreadsheets a tempting choice for managing ARO tracking and reporting. However, as highlighted in the webinar, this very flexibility can become a significant drawback.
The Key Problems with Spreadsheets in ARO Management
- Data Integrity Issues
- Manual Errors: Spreadsheets are prone to human error. Data entry mistakes, formula errors, and accidental deletions can lead to inaccurate information, which can have serious implications for financial reporting and compliance.
- Version Control: With multiple users accessing and modifying spreadsheets, keeping track of the most recent and accurate version can become a challenge, leading to discrepancies and confusion.
- Scalability Challenges
- Complexity Over Time: As organizations grow and ARO portfolios become more complex, spreadsheets often struggle to keep up. Managing large volumes of data and performing complex calculations can slow down spreadsheet performance and increase the risk of errors.
- Integration Issues: Spreadsheets typically operate in isolation, making it difficult to integrate with other financial systems and databases. This lack of integration can hinder comprehensive reporting and analysis.
- Limited Collaboration Capabilities
- Real-Time Collaboration: Spreadsheets are often not designed for real-time collaboration. Multiple users working on a spreadsheet simultaneously can lead to conflicts and inconsistencies.
- Access Control: Managing who has access to sensitive ARO data and ensuring that permissions are correctly set can be cumbersome in a spreadsheet environment.
- Compliance and Audit Difficulties
- Documentation Gaps: Spreadsheets lack built-in audit trails and documentation features. This makes it challenging to track changes, verify calculations, and ensure compliance with regulatory requirements.
- Risk of Non-Compliance: The inability to easily track and manage complex ARO obligations can lead to potential compliance issues and financial penalties.
A Better Solution: Specialized ARO Management Software
Given these challenges, it’s clear that relying solely on spreadsheets for ARO management is not sustainable. Specialized ARO software offers a more robust and reliable solution. Here’s why:
- Enhanced Data Integrity
- Automated Calculations: Specialized software reduces the risk of manual errors by automating calculations and data entries.
- Centralized Data: These solutions centralize data management, ensuring consistency and accuracy across the board.
- Scalability and Integration
- Efficient Data Handling: Designed to handle complex and voluminous data, specialized software can scale with your organization’s needs.
- Seamless Integration: Modern ARO management tools integrate with other financial systems, facilitating comprehensive analysis and reporting.
- Improved Collaboration
- Real-Time Updates: Advanced software enables real-time collaboration and updates, allowing multiple users to work efficiently without conflicts.
- Controlled Access: Enhanced security features and access controls ensure that sensitive data is protected and managed appropriately.
- Compliance and Audit Readiness
- Audit Trails: Specialized software provides detailed audit trails and documentation features, making it easier to track changes and maintain compliance.
- Regulatory Alignment: These tools are often designed to meet regulatory requirements, helping organizations avoid compliance issues and penalties.
Conclusion
The XI Technologies webinar underscores a critical point: while spreadsheets have served their purpose for many years, their limitations fall short when it comes to managing complex datasets required for ARO tracking and reporting. Given the industry’s increasing importance on ARO in relation to securing funding, adhering to regulatory compliance, and performing acquisition and divestiture analysis, it’s time to embrace software that can mitigate the risks associated with spreadsheets, enhance data integrity, and streamline compliance processes.
For more insights and a deep dive into the problems with spreadsheets, check out the full webinar by XI Technologies here.
The AER has posted a video on the new direct to provide updated industry parameters and regional abandonment and reclamation costs used in calculating liability under the Licensee Liability Program. Watch their video here.
—
Upcoming Certification Course:
ARO Manager For Financial Tracking and Reporting Certification Course provides practical, hands-on professional development for anyone interested in expanding their knowledge of Asset Retirement Obligation (ARO) tracking and reporting.
When: October 22st and October 24rd at 9:00am
Space is limited so be sure to register now for the course. This is 2 x half- day course taking place in person at the XI office.
Each week, XI Technologies uncovers trends and insights using our enhanced data and software focused on the WCSB. If you’d like Word to the Wise delivered directly to your inbox, subscribe here. For more tips and to learn about how XI’s AssetSuite can help with your high-level analysis visit XI’s website or contact XI for a demo.