Whitecap and Veren Combined – XI Takes a Look at the Analytics Involved
March 18, 2025
Whitecap Resources Inc. (“Whitecap”) and Veren Inc. (“Veren”) have announced a strategic combination for $15 billion. The result of this all-share merger is the creation of the largest landholder in Alberta’s Montney and Duverney regions, two of North America’s most important shale plays. In this article, XI Technologies uses AssetBook – the largest asset evaluation tool in the Western Canadian Sedimentary Basin (WCSB) – to analyze the potential strategies involved.
First, AssetBook has identified Whitecap at roughly 170k barrels of oil per day (BOE/d) and Veren at $167k BOE/d, jumping this new company into the 5th spot of largest producers in the WCSB, with the top spots still held by Canadian Natural Resources Ltd at $948k BOE/d, Cenovus Energy Inc. at $779k BOE/d, Tourmaline Oil Corp. at 542k BOE/d and Ovintiv Canada Ulc at $343k BOE/d.
This deal would translate to a new company valuation of roughly $44,500 a flowing boe using the AssetBook ownership module. XI uses a 6:1 Boe ratio which, given the liquid nature of the main gas play for this deal, will be a little conservative. Using the valuation from the press report, the company is claiming a combined boe of $370,000 or $40,540 a flowing boe. As AssetBook does not include any production from mined operations, our numbers are for production that is coming from wells only.
Next, XI Technologies evaluated the Whitecap and Veren combination through different lenses using AssetSuite software tools, looking at each company’s asset profile plus the combined entity, to gain valuable insight into the transaction. Consideration was given to the fall out and which other players in the area may be affected. This deep dive gives a comprehensive understanding and full picture of the resulting acquisition.
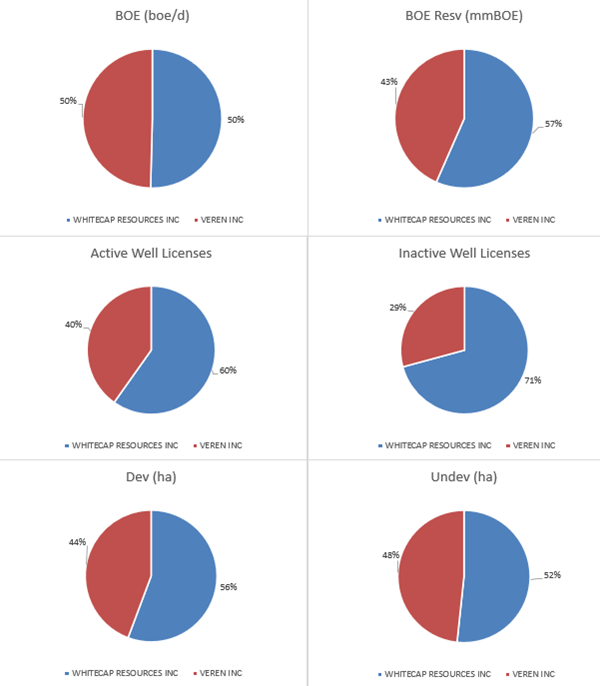
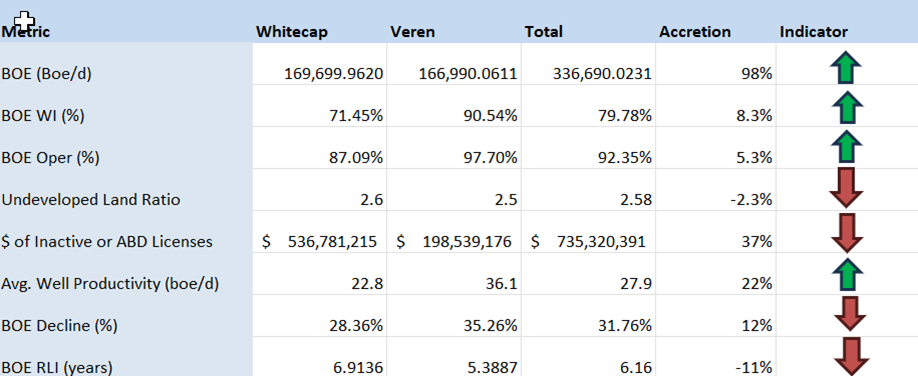
While the absolute numbers tell one story, accretion and dilution metrics tell us more. Looking at the AssetSuite summary, we can calculate some accretion and dilution metrics for this transaction relative to the increase in production.
Per Figure 2 below, based on Whitecap absorbing Veren, Whitecap’s production base will almost double through this acquisition, while liabilities will only increase by 37%. The Veren assets don’t appear to be quite as long lived as Whitecap’s base, but they do potentially add operational efficiency with a substantial increase in the average well rate.
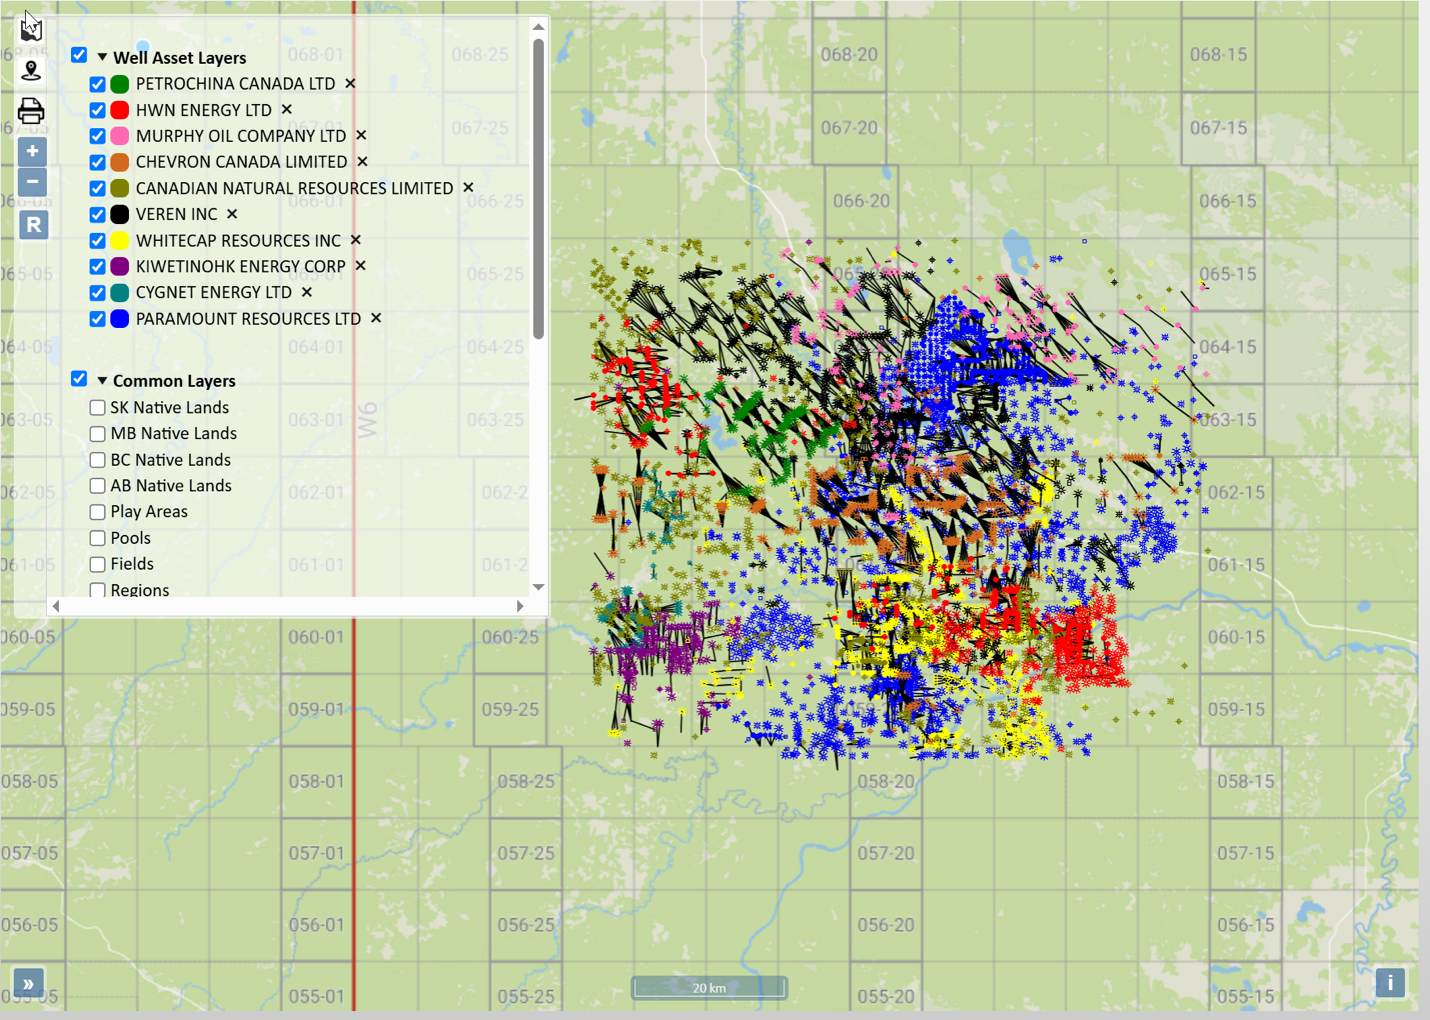
The best way to see the core of this deal is to overlay Veren’s production heat map on Whitecap’s well map. Both companies are quite spread out making it unlikely that anything will become a fall out property from this deal.
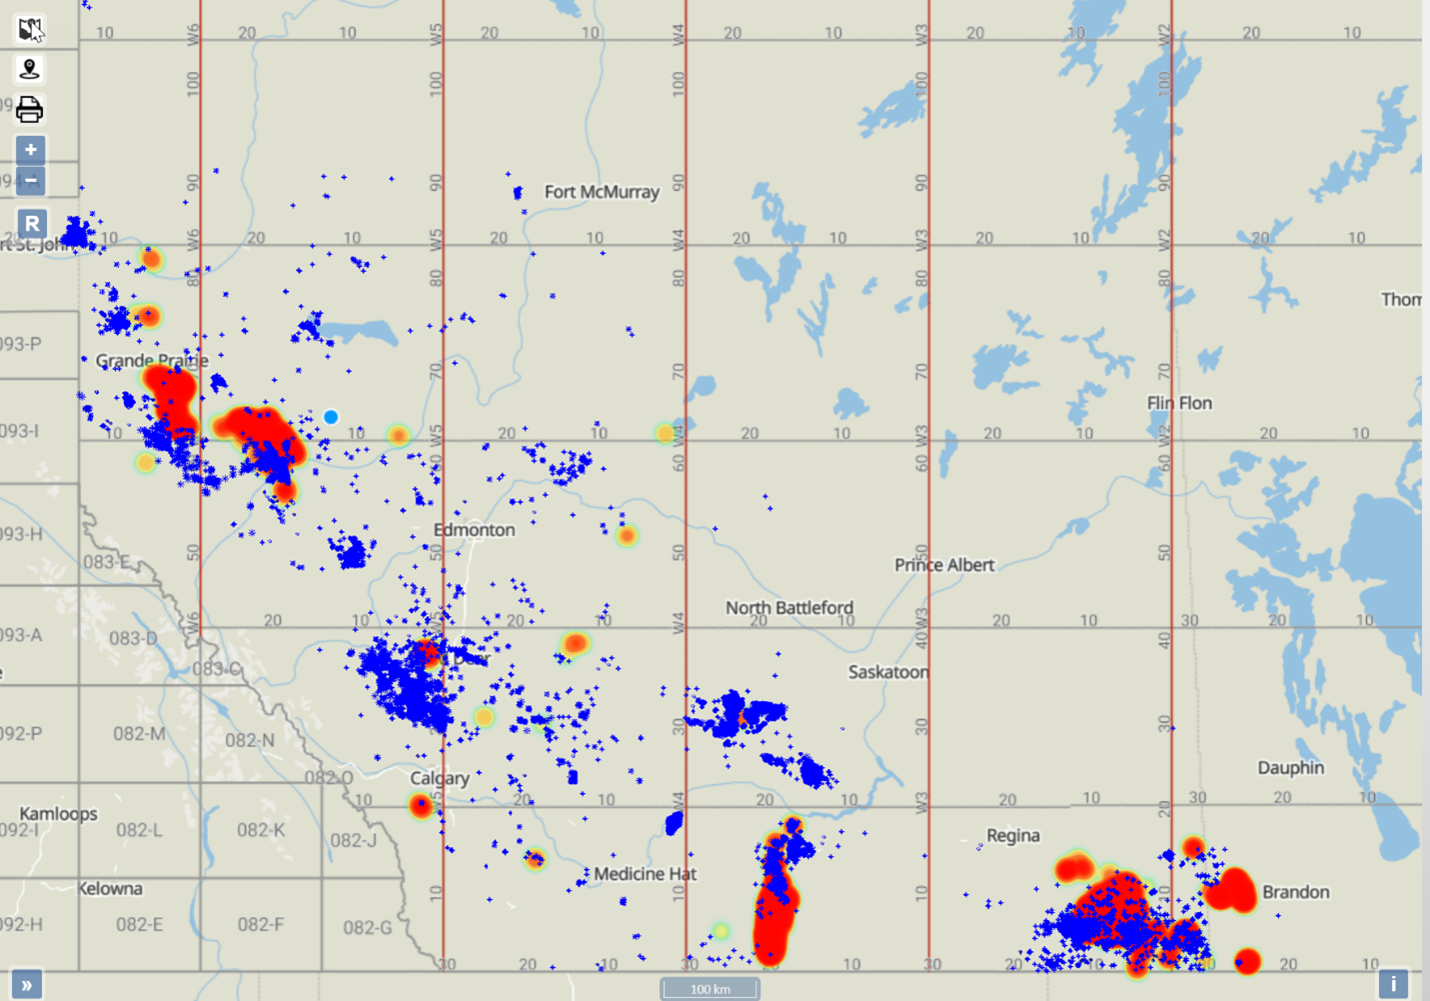
We can also view the combined production in a heat map (Figure 4 below) to see where the largest increases are.
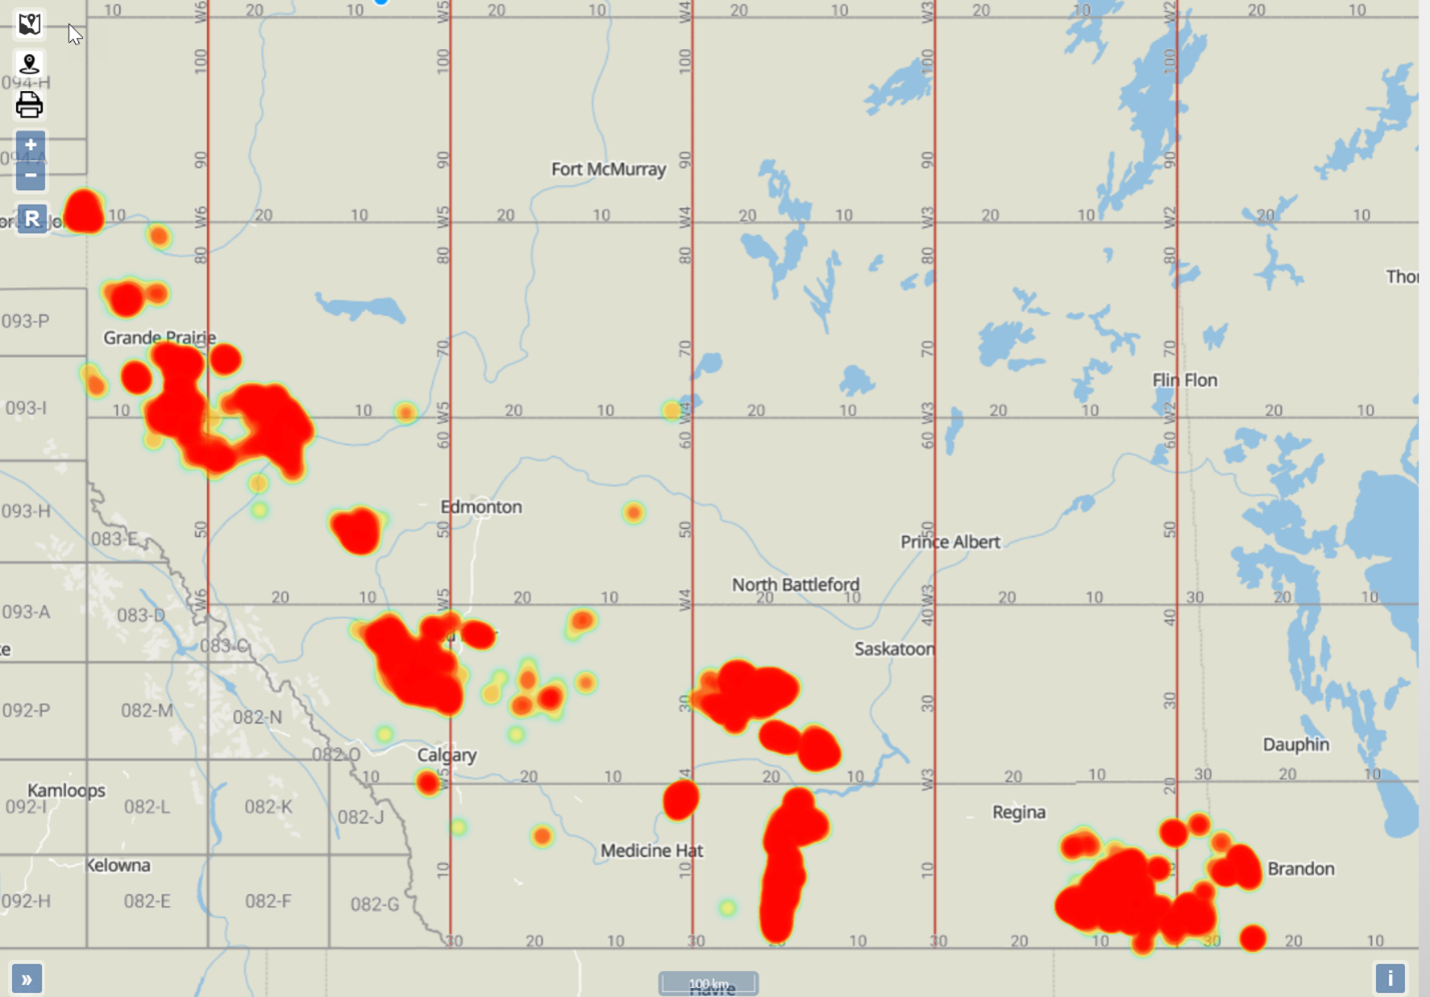
Figure 4 – Map of Whitecap and Veren assets. Source: XI Technologies AssetBookAs this arrangement augments the production in Montney and Duverney plays, it is worth looking at the production graph for each.
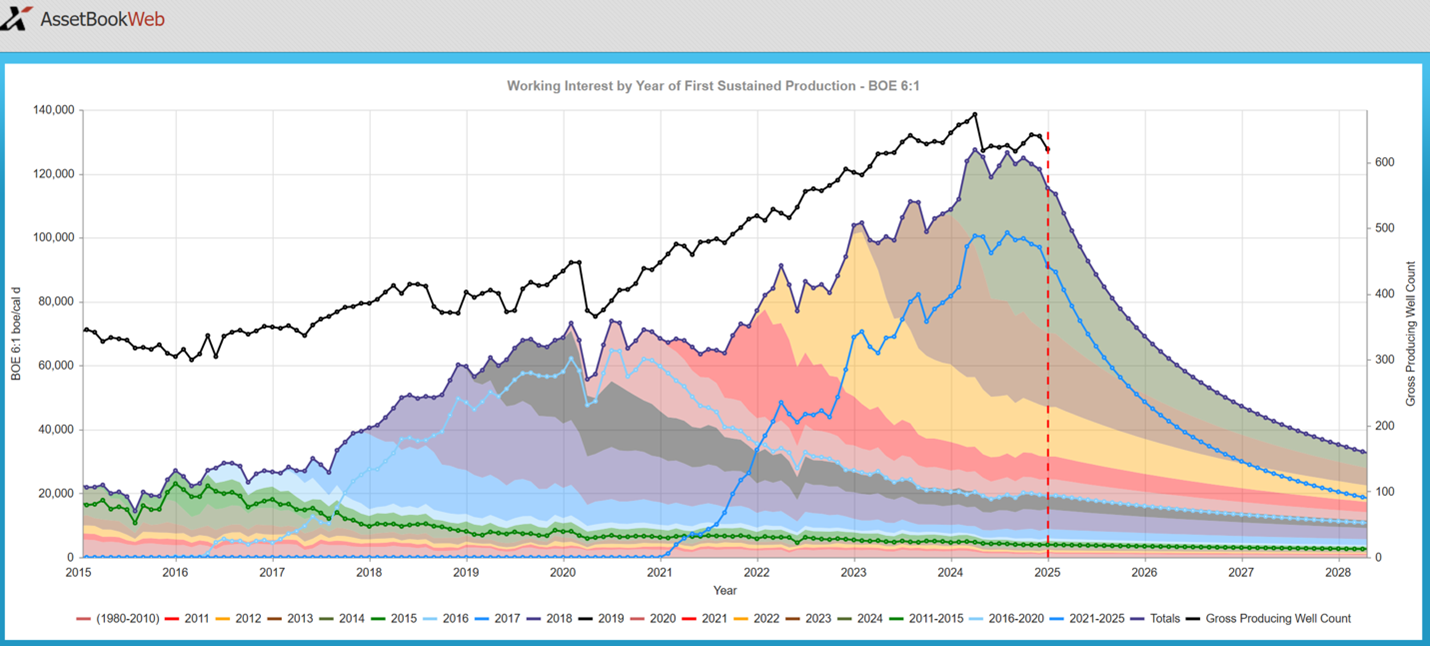
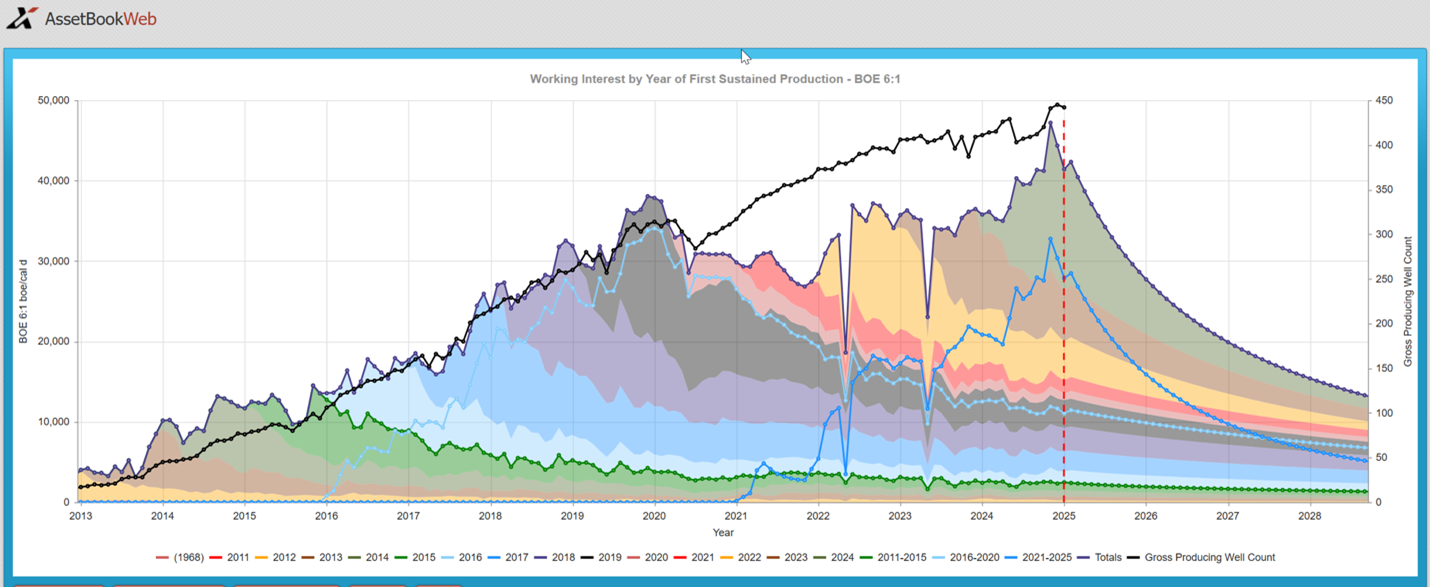
Figure 5 & 6 – Graph of zones for Whitecap and Veren combined assets – Montney Play and Duvernay Play respectively. Source: XI Technologies AssetBook
A CORE AREA OVERVIEW
With the AssetBook we can create an area around the different plays or geographical interests and analyze the competition or potential further acquisition opportunities. Let’s view their Duvernay area and see what strategic moves could be addressed.
Drawing a box from 59-16 to 65-24 below gives us a good bounding around this play for this new entity. This area is predominantly Duvernay production with approximately 74% of the production coming from this zone.
The new Veren/Whitecap entity is the largest player in this area with approximately 56,213 boe/d of the 174,448 boe/d producing from this area, representing 32.23% of the region’s total production. The area has 55 producers and over 80% of the production is held by the top 10 producers. This is primarily a gas producing area with slightly more than 85% of the production coming from gas. Download more information on the companies in this area here.
Want to learn how to discover these metrics on your own, or use XI’s AssetSuite to evaluate your next merge or acquisition? Book a product demo today!
Upcoming Events / Trainings:
AROManager Webinar:
ARO Manager for Financial Tracking & Reporting
- Get a more complete picture of asset retirement costs.
- Cost management is a vital part of the business and operating strategy for every Canadian oil and gas producer. But if you are focused primarily on development and operations costs, then you are missing a significant part of the picture.
- AssetBook ARO Manager is the first and only software application specifically designed for estimating and monitoring asset retirement obligations (ARO) in the Western Canada oil and gas sector. For exploration and production companies, ARO Manager provides transparency and SOC-compliant assurance when monitoring and tracking liabilities for financial reporting.
March 25th, 2025, 9:00am (MST) hosted online. Register today!
ARO Manager For Financial Tracking and Reporting Certification Course provides practical, hands-on professional development for anyone interested in expanding their knowledge of Asset Retirement Obligation (ARO) tracking and reporting.
When: April 15th and April 17th at 9:00am
Space is limited so be sure to register now for the course. This is 2x half- day course taking place in person at the XI office.
AssetBook 101: This introduction to AssetBook course will help you identify potential new clients and opportunities for acquisitions, divestitures, mergers, trades, and farm-in potential.
When: April 15th at 2pm (in person at our Office)
Length: 1 Hour
ARO Manager 101: This introduction to AssetBook ARO Manager will help you create new projects, navigate, and view cost models.
When: March 20th at 9am and April 17th at 1pm (both are in person at our Office)
Length: 1 Hour
Getting the Most Out of Maps Information: Discover the available functions and workflows utilizing all aspects of the mapping tool, including:
- Searching using corners or polygons
- Layering sets of assets on the map
- Searching using mapped assets
- Workflow demonstrations to show assets on the map that meet set criteria
When: April 30th 1pm (Online)
Length: 30 minutes
Using LCA & LLR reports to your Advantage: Learn how to run an LCA and LLR report, and how these reports align with Directive 088 with regards to A&D Scoping.
When: April 29th at 9am
Length: 30 minutes
H2S Reporting – Why Accuracy, Efficiency, and Compliance Matters
Struggling to meet H2S reporting requirements with limited resources or time? We’ve got you covered.
In our latest webinar, we provided valuable insights on:
- Regulatory rules and expectations, including revisions to Directive 056.
- How to ensure compliance, find efficiencies, save costs, and work as a team for consistent and transparent APEGA-approved reporting.
- Manage mergers, acquisitions and divestitures with ease (no duplication of reports).
- Learn about H2SComplete as a full solution to help you quickly manage and mitigate risks associated with hydrogen sulfide (H2S) safety.
XI Technologies has moved to our NEW LOCATION:
XI Technologies Inc.
2400 – 500 4th Avenue SW (Altius Centre)
Calgary, Alberta T2P 2V6