WTTW: “From Lease to Release” – April 2024 Alberta Expiring Land Report
April 2, 2024
XI Technologies looks at expiring land to provide useful business development intel for both service companies and exploration and production (E&P) companies alike.
For service companies, expiring lands provide insight into where drilling activity is most likely to occur over the coming months, and who is behind it. For E&Ps, the expiring land report helps flag farm-in opportunities and/or land that may become available in your core area(s). According to AssetBook data, these are the top 25 companies with expiring lands in Alberta over the next 12 months:
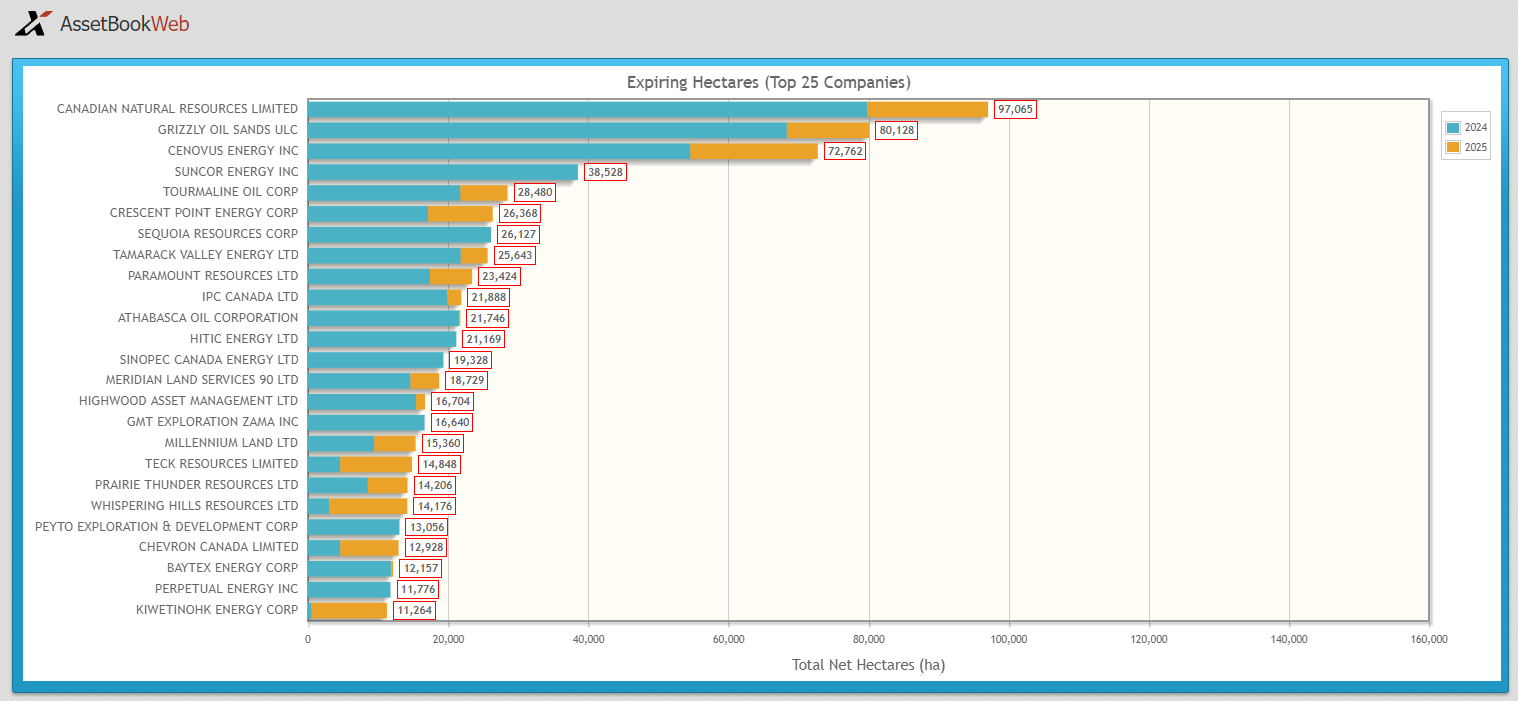
25 of 242 companies represent 62% of land expiring in the next 12 months.
When looking at the top 25 companies (Fig. 1), it is also useful to look at the land numbers in context to the overall total of expiring land. These 25 companies represent 62% of the total 674,501 hectares (ha) expiring in Alberta in the next 12 months. An additional 217 companies represent the remaining 38% of expiring land.
Looking at the same land search after removing the expiry criteria, and grouping by company, we can calculate that the top 25 companies by total hectares in Alberta represent 50% of the total crown land in Alberta. They represent 8% of all companies with crown land but hold 50% of the total 29.9million crown hectares in the province. The total of 674,501 ha expiring represents 2.3% of Alberta’s total 29.9 million crown hectares.
2.3% of the total land in Alberta is expiring in the next 12 months.
Comparing expiring land to total land by company for the top 25 companies listed above, we can see how the expiring land compares to their total land base. The percentage of total expiring ranges from 2% to 64% with an average of 14%
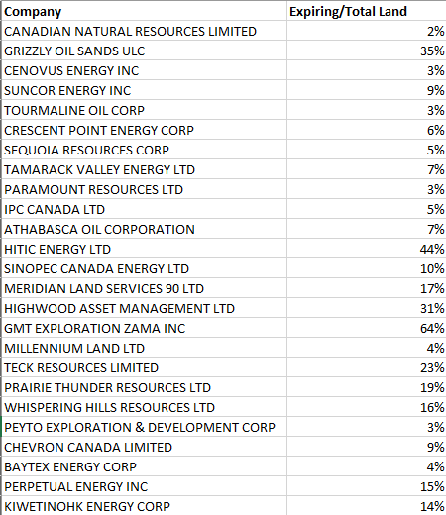
Collectively, the top 25 companies with expiring land represents an average of 14% of total land holdings.
The total percentage of the company’s land expiring might be a factor when looking at potential opportunities. This percentage, however, is only one piece of the puzzle when looking at opportunities.
In addition to knowing the top 25 companies with lands nearing expiry, it may be useful to know the bonus amounts that were paid on those lands. AssetBook allows you to easily identify and rank expiring lands based on the size of bonuses paid. This will help you prioritize companies that have the most money on the line and therefore may be more open to farm-in or partnership opportunities.
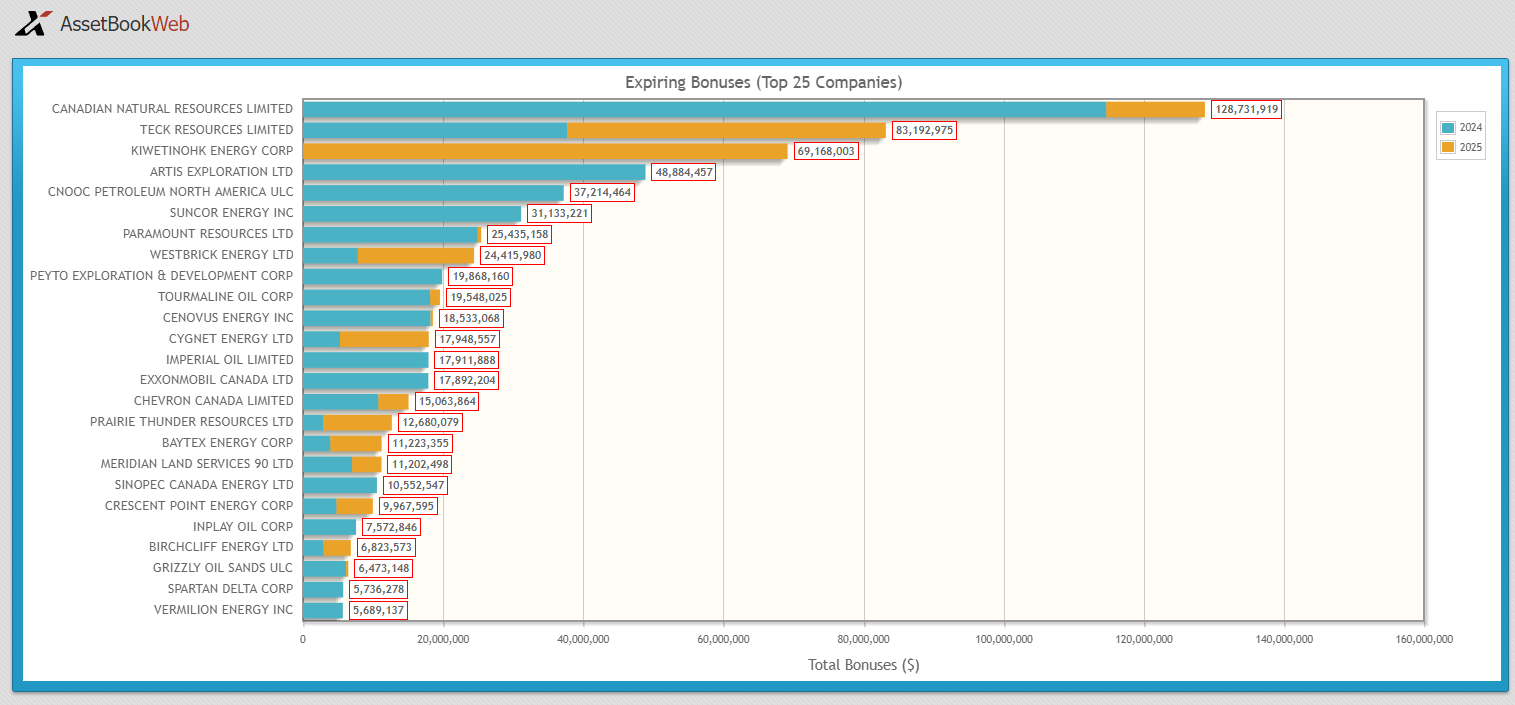
As with the total land, the top 25 companies, or 8% of the total companies, represent 75% of the total expiring bonuses.
By comparing the two charts, and corresponding values, you can calculate the average $/ha for these top 25 companies. They may have significant value expiring, but how does the total compare to the total ha expiring? How valuable is the land expiring relative to the total pool of expiring land?
By plotting $/ha from highest to lowest, you can see the value of the land expiring by company. This gives you an understanding of how valuable the land might be to each company, which may correlate to motivation to explore opportunities.
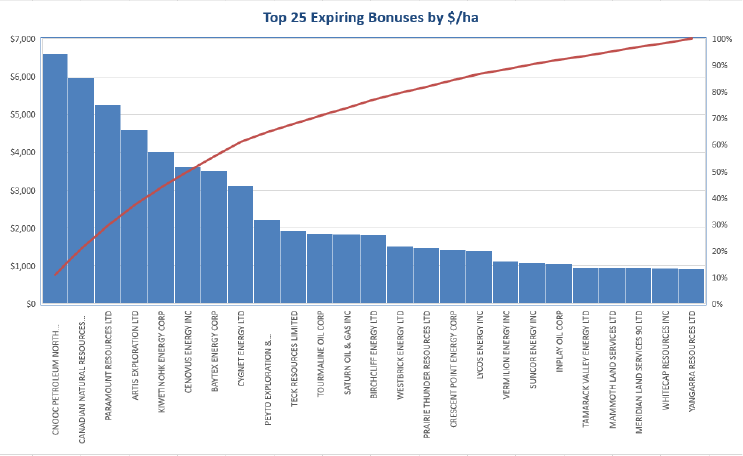
The value per ha of land expiring in the next 12 months ranges from +$15,000 to <$100.
There is a significant range of value per hectare on the lands expiring in the next 12 months.
When looking at potential opportunities, the total numbers are only a starting point. Looking at the totals in context of both overall company totals as well as the unique value of the land itself can give you a better picture of how valuable the land may be to each unique company.
Is there more you would like to see in the expiring land report? Contact us here.
AssetBook allows you to search for expiring lands by province, by company, or by any geographic area. The results can be viewed in tabular format or displayed on a map to help with visualization. To learn more about how the data in AssetBook can help you, contact XI Technologies.
Upcoming Webinar: Join us for a special presentation on ARO for Financial Tracking & Reporting.
When: April 25th 10:00am (MST) – Register Now!
Upcoming Certification Course:
ARO Manager For Financial Tracking and Reporting Certification Course provides practical, hands-on professional development for anyone interested in expanding their knowledge of Asset Retirement Obligation (ARO) tracking and reporting.
When: April 30 and May 2 at 9:00am
Space is limited so be sure to register now for the course. This is a 2 x half-day course taking place in person at the XI office on morning of April 30th and the morning of May 2nd. Register here.
Each week, XI Technologies uncovers trends and insights using our enhanced data and software focused on the WCSB. If you’d like Word to the Wise delivered directly to your inbox, subscribe here. For more tips and to learn about how XI’s AssetSuite can help with your high-level analysis visit XI’s website or contact XI for a demo.