Word To The Wise: Dodsland overview
March 28, 2023
Each week, XI Technologies scans their unique combination of enhanced industry data to provide trends and insights that have value for professionals doing business in the WCSB. If you’d like the Word to the Wise delivered directly to your inbox, subscribe here.
The Dodsland Field in Southeast Saskatchewan was discovered around the early 1950s and was known for its gas reserves until the discovery of oil in 1958. It consisted of vertical wells drilled up until 2009, and since has been predominately horizontal oil producers focused on the Dodsland Viking sand.
In Saskatchewan, the Dodsland field has the most net wells drilled in the last 12 months.
Since Jan 2022 there have been 211 wells spudded, and out of ones with proved production, they have an avg IP90 BOE rate of 72 boe/d.
Ownership in Dodsland Assets
The top ten companies own 99% of the producing assets in this area. Out of those, seven companies have been active within the last year. The map below shows the top ten companies (based on current boe/d) in this area.
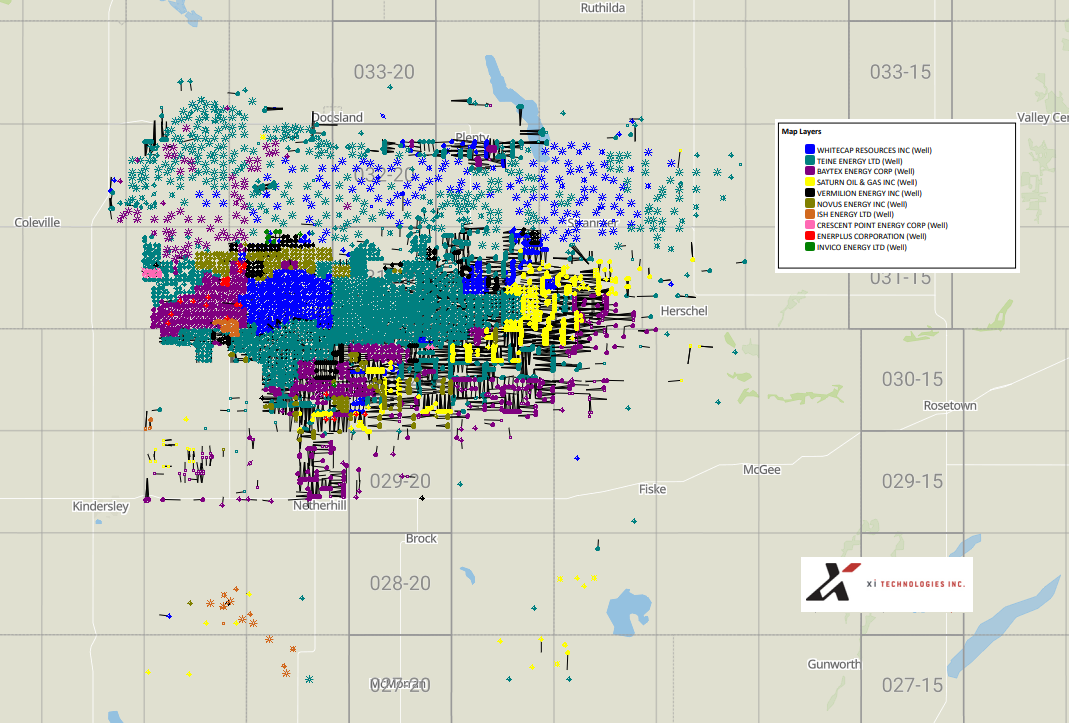
Figure 1: Map of the producing wells for the top ten companies in Dodsland.
Production history of Dodsland assets
Let’s investigate this area a little further. Over 92% of the production in this area is coming from the Viking formation.
Looking at the production of the top ten companies, this area is a significant portion of some top companies’ overall production. For example, this area makes up 32% of Teine Energy’s production, 6% of Baytex Energy and 21% of Saturn Oil & Gas.
Click here to download a report of all companies in the Dodsland.
The production history of the top ten companies shows that Teine has the largest increase in production in the area. 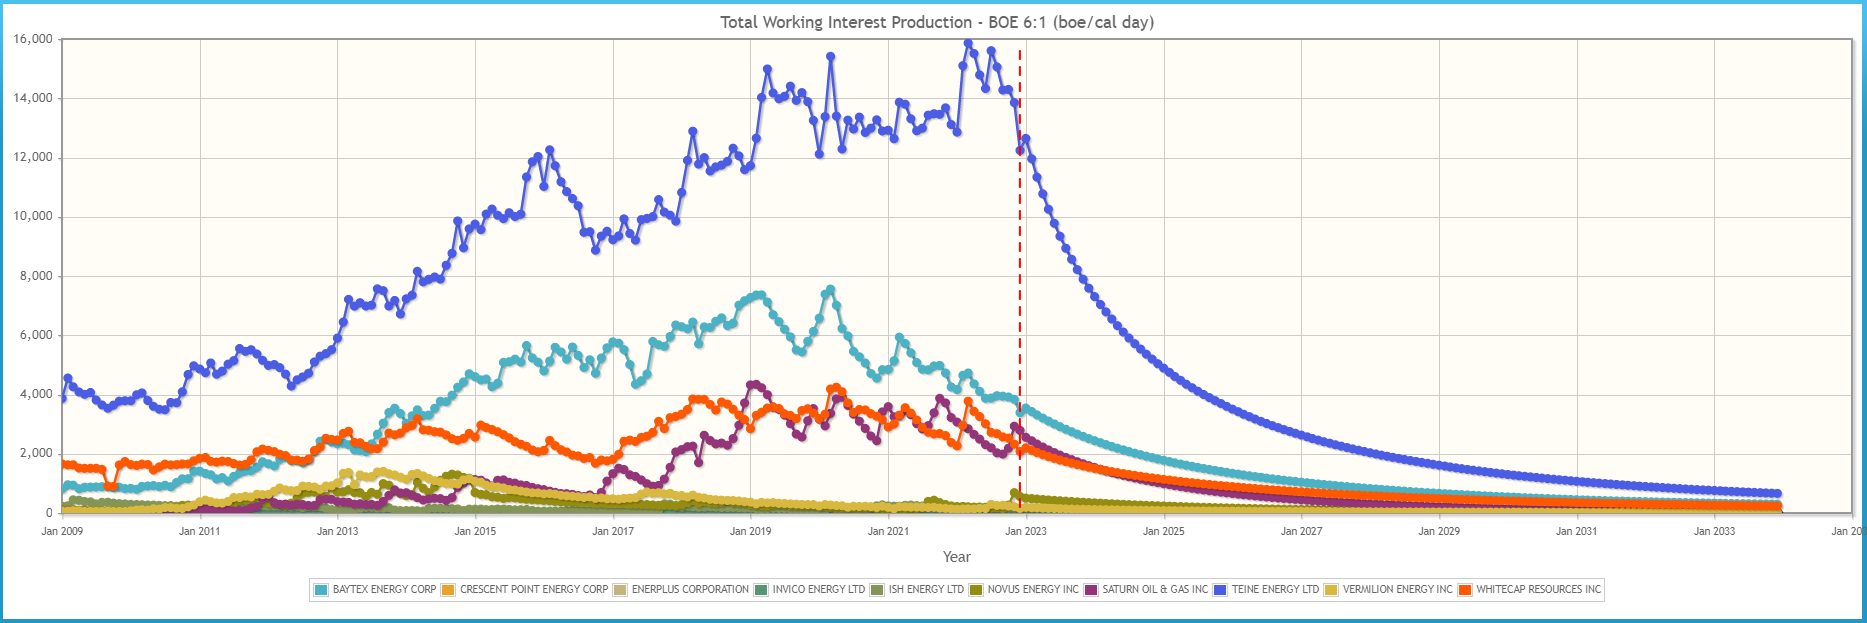 Figure 2: Total Working Interest Production of the top ten companies.
Expiring Land
Looking forward, are there any leases in these areas that are expiring in the next year to indicate an area that may increase in drilling?
Focusing on undeveloped lands, there are 113 undeveloped leases expiring across approximately 17,435 undeveloped hectares. Here’s a look at the expiring hectares by the top twenty-five companies in the next year.
 Figure 3: Land Expiries (ha) of Top 25 companies in the next year.
Company operations
Among the top eight companies (by current boe/d), we can look at their marginal well ratios over time to potentially give insight into operational efficiency. This data is obtained from our LCA Report and a snapshot can be seen below.
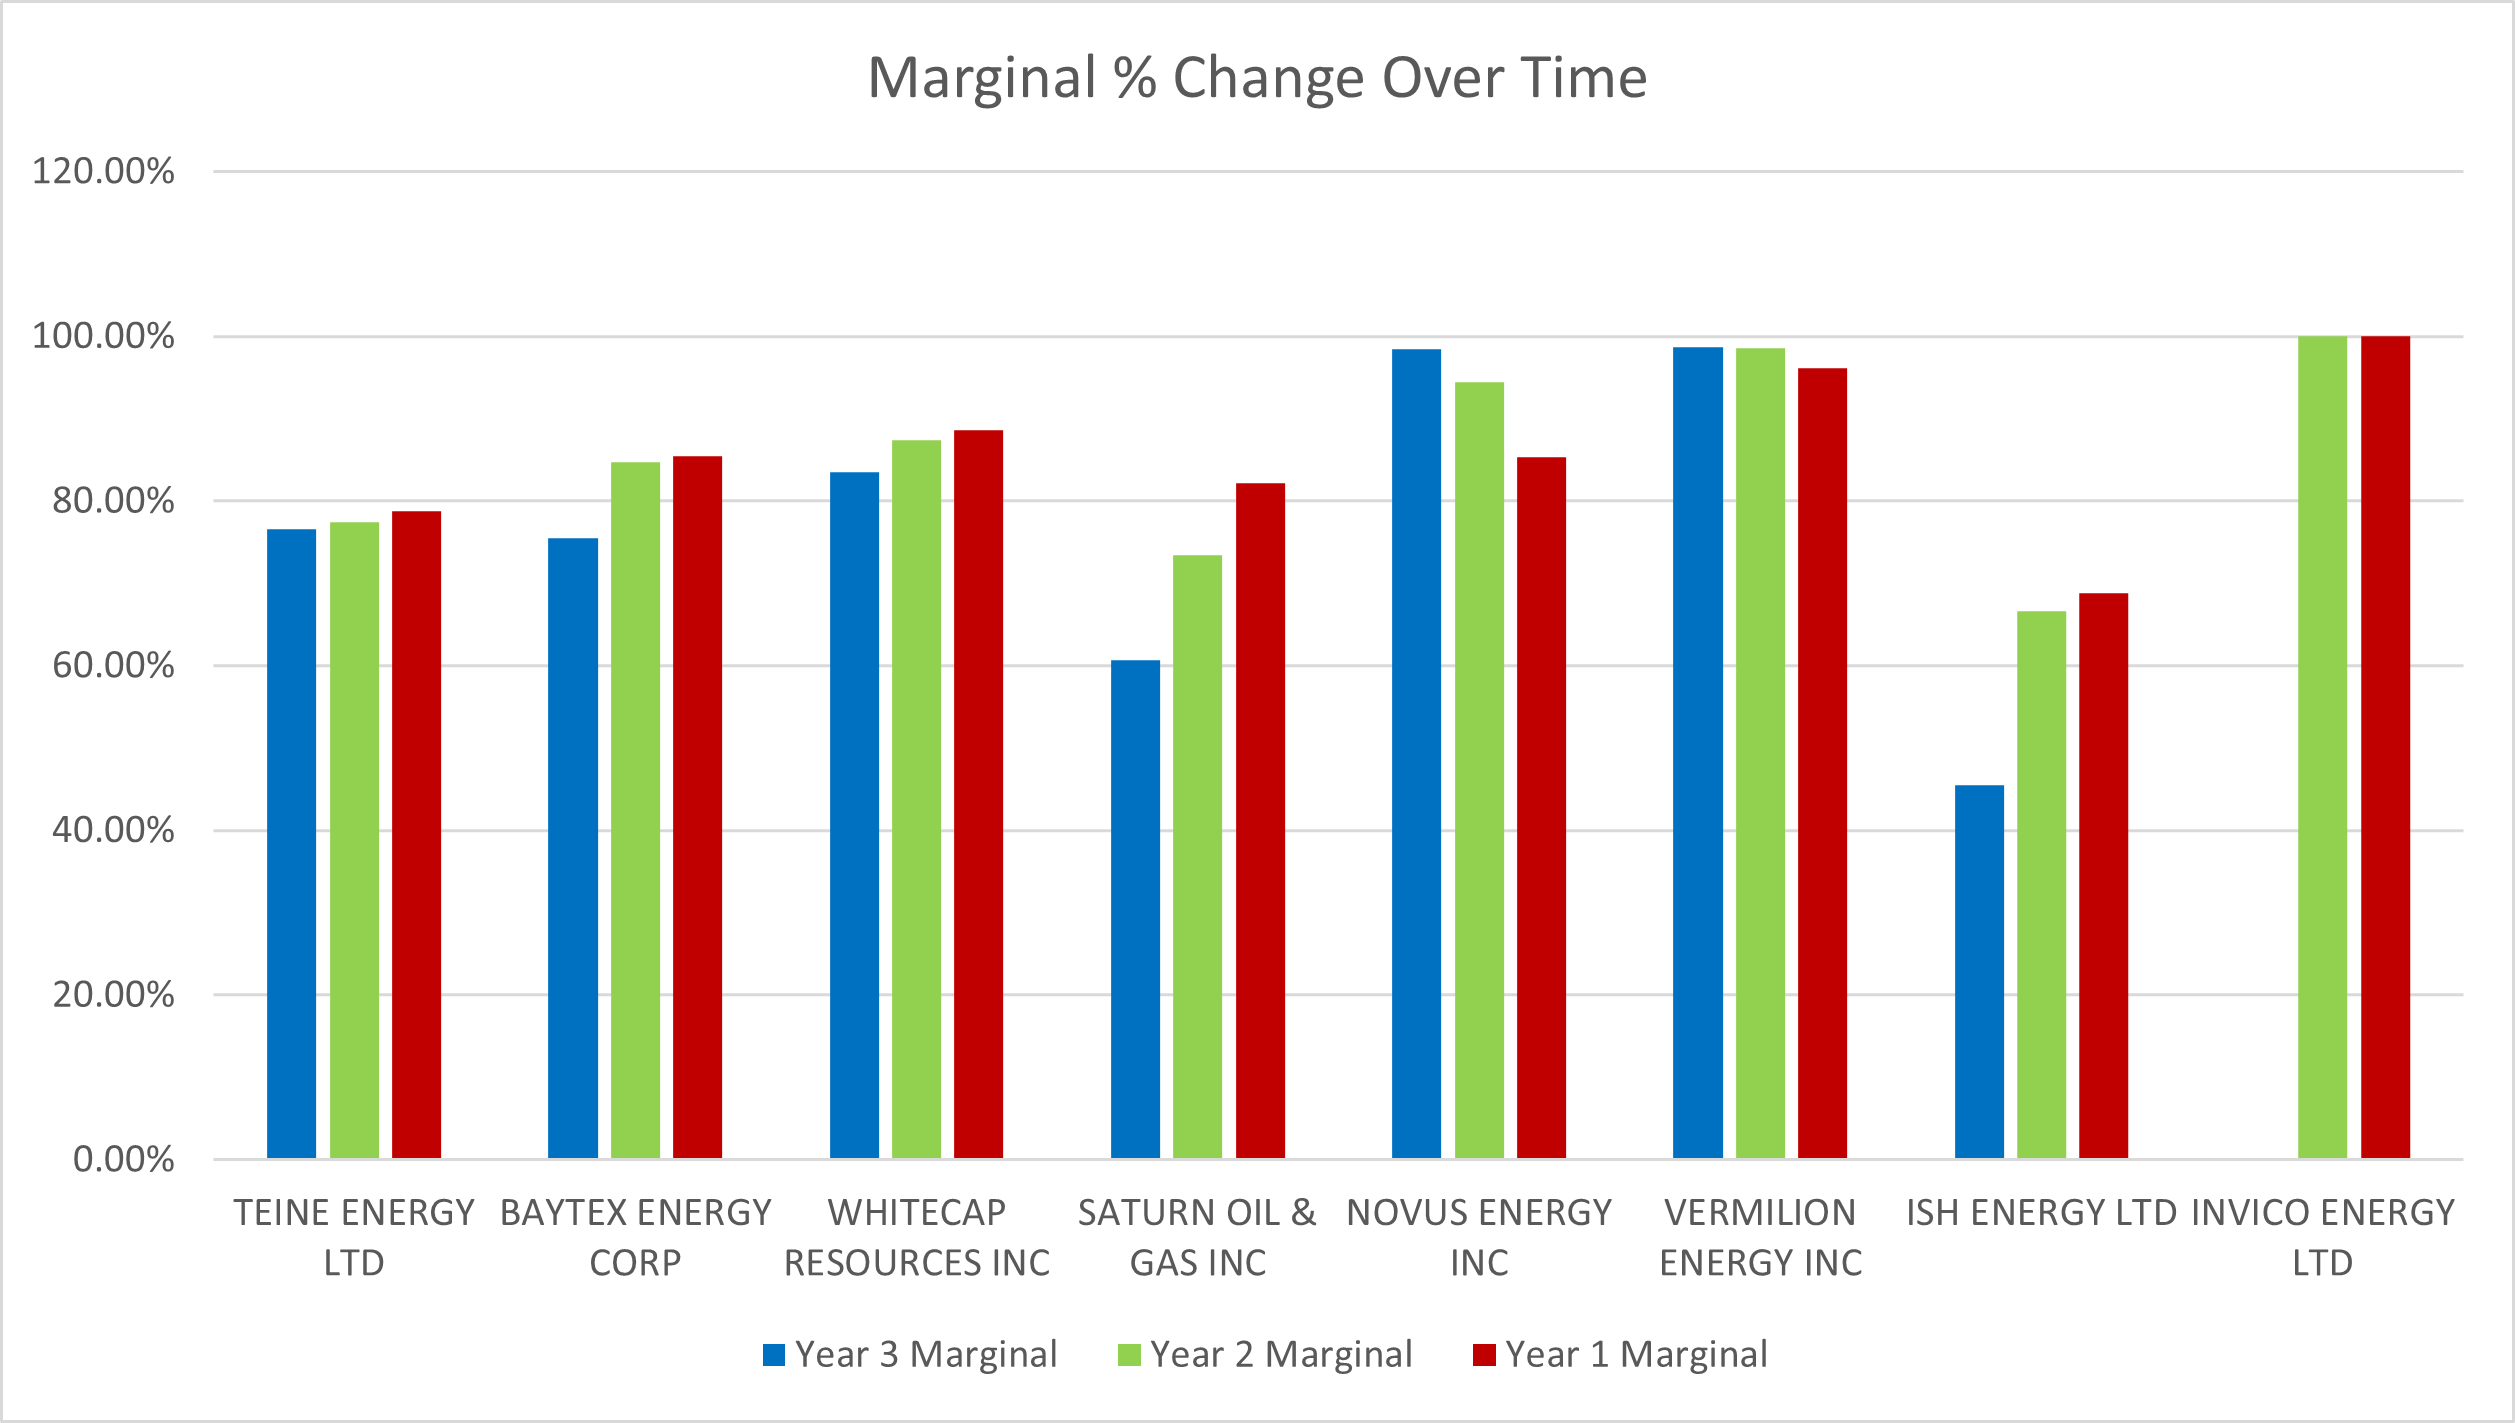 Figure 4 – Marginal Change Over Time
Marginal well % is defined as wells producing less than 10 boe/d divided by all producing wells.
Click here to download an LCA report on the companies with assets in the Dodsland Field.
Liabilities in Dodsland
While these assets are conventional, it is still important to look at liabilities among various acquisition opportunities to determine differences in future obligations. Although there are many more active wells in this area, there are still 1,904 inactive wells. This translates to over $178 million of liability associated with these inactive wells.
Note: Liability costs displayed in the report below are based on XI’s ARO cost model.
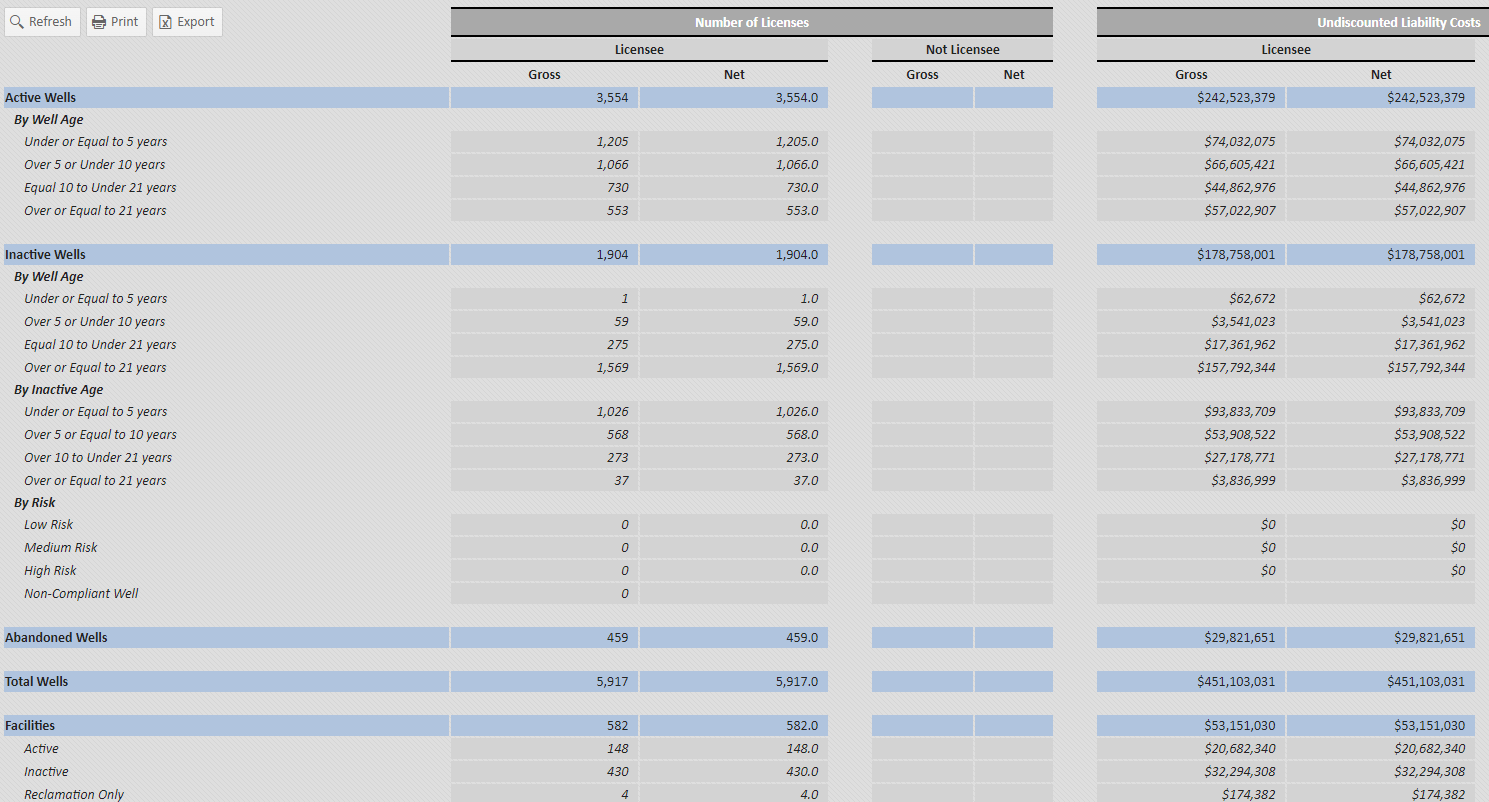 Figure 5: ARO Manager’s Project Overview Report
Click here to download an ARO report on the Dodsland Field
Emissions in Dodsland
A quick snapshot of the Scope 1 GHG Emissions from the AssetBook Emissions Report for the facilities in this area show that in the last 12 months, approximately 450,000 tonnes CO2e has been produced.
In recent years, the area has established emission reduction and gas production infrastructure and currently sits at an average gas conservation rate of 82%. About 2/3 of emissions in the field are from venting. As you can see from the graph below, there has been a steady decrease in the amount of venting since early 2020.
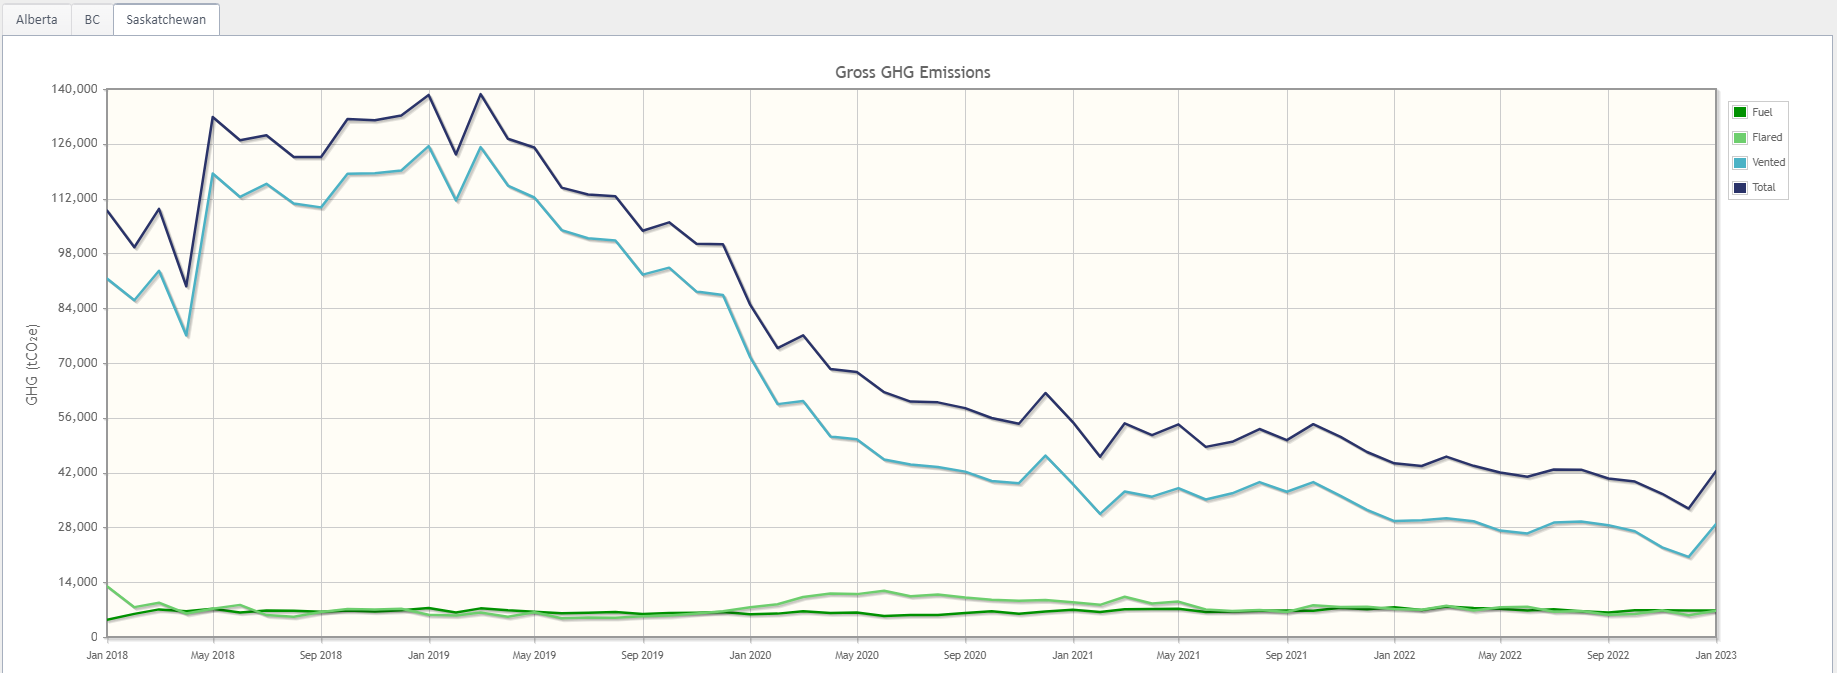 Figure 6: Gross GHG Emissions
Next week, we’ll look at this area from a drilling perspective to gain more insight.
If you’d like to learn more about how XI’s AssetSuite software can analyze companies, packages, or regions throughout Western Canada, visit our website or contact XI Technologies.