Word to the Wise: How to solve the problem of incomplete STICK diagram information
February 6, 2019

In 2018, the Alberta Energy Regulator (AER) published a list of the “Five Most Common Noncompliances in Ten Inspection Categories”. The #1 issue for the Drilling Category was: “STICK Diagram does not contain all the required information.”
Each week at XI Technologies, we scan our unique combination of enhanced industry data to provide trends and insights that have value for professionals doing business in the WCSB. If you’d like our Wednesday Word to the Wise delivered directly to your inbox, subscribe here.
A STICK diagram is a well data information sheet specific to the drilling operation of a well. It is obtained from researching offset well records and provides on-site personnel with sufficient well control information and must be posted in the doghouse. At a minimum, the STICK diagram must include:
- geological tops,
- anticipated formation pressures and mud weights required to control them,
- potential problem zones (e.g., lost circulation, water flows, gas flows),
- abnormal pressured zones (e.g., reservoir pressure maintenance),
- potential H2S zones, and
- other well occurrence information.
Traditionally, all this information was gathered primarily through manual offset research – digging through AER data stores to find relevant offset wells, then scouring through PDF Tour sheets and other data. If the word “tedious” comes to mind, you’re right. It’s easy to see why this would be a time-consuming process and how key information might be missed.
The evolution of the digital oilfield means this data is now much more accessible and XI Technologies has multiple proven tools that make it faster and easier to gather the information needed for STICK diagrams while, at the same time, meeting other regulatory requirements for Surface Casing and H2S.
XI’s RegulatorySuite is an a la carte set of data mining, research, and report building tools packaged in a simple web-based platform. Its purpose is to help companies streamline and simplify compliance with AER Directives. For example, Directive 36 includes the requirement to have the pressures information available to on-site personnel (11.1.4) and these are available in XI’s SurfaceCasing Report. But Directive 36 also requires that potential H2S zones be indicated. XI has added the ability to collect this information and generate the start to your STICK diagram within the SurfaceCasing Report and export it. The system also includes the ability to link your H2S Report work to that export, helping you gather all the information in one step.

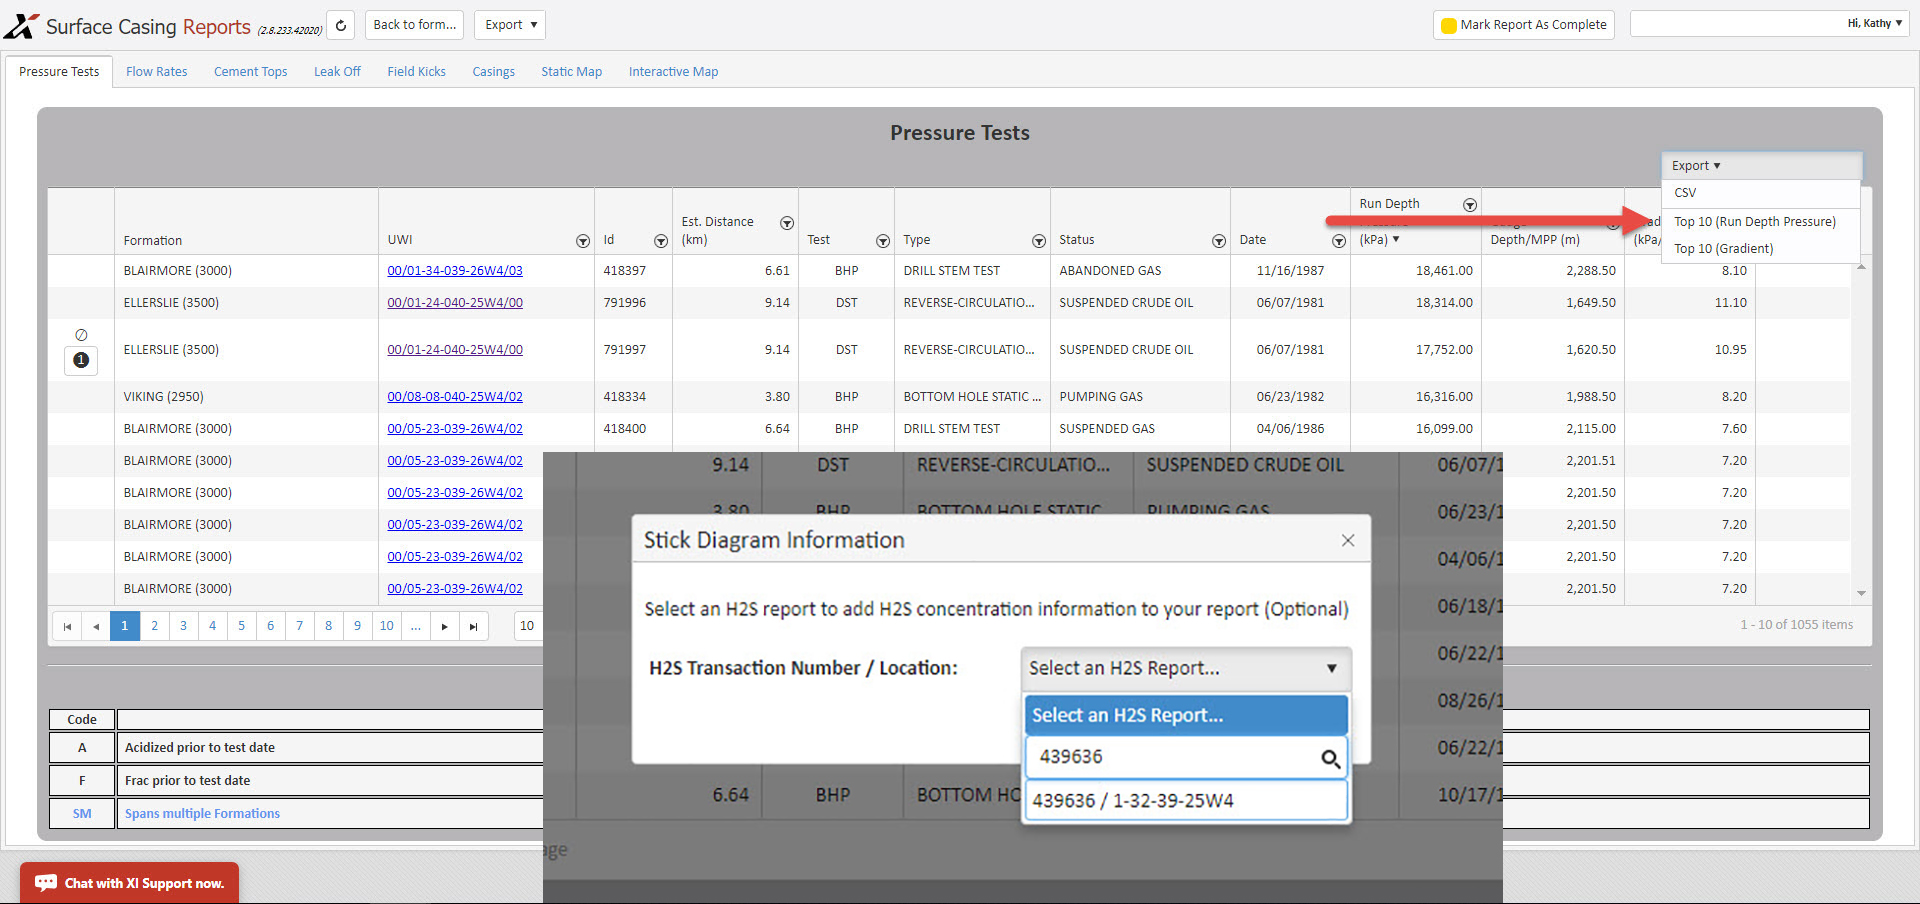
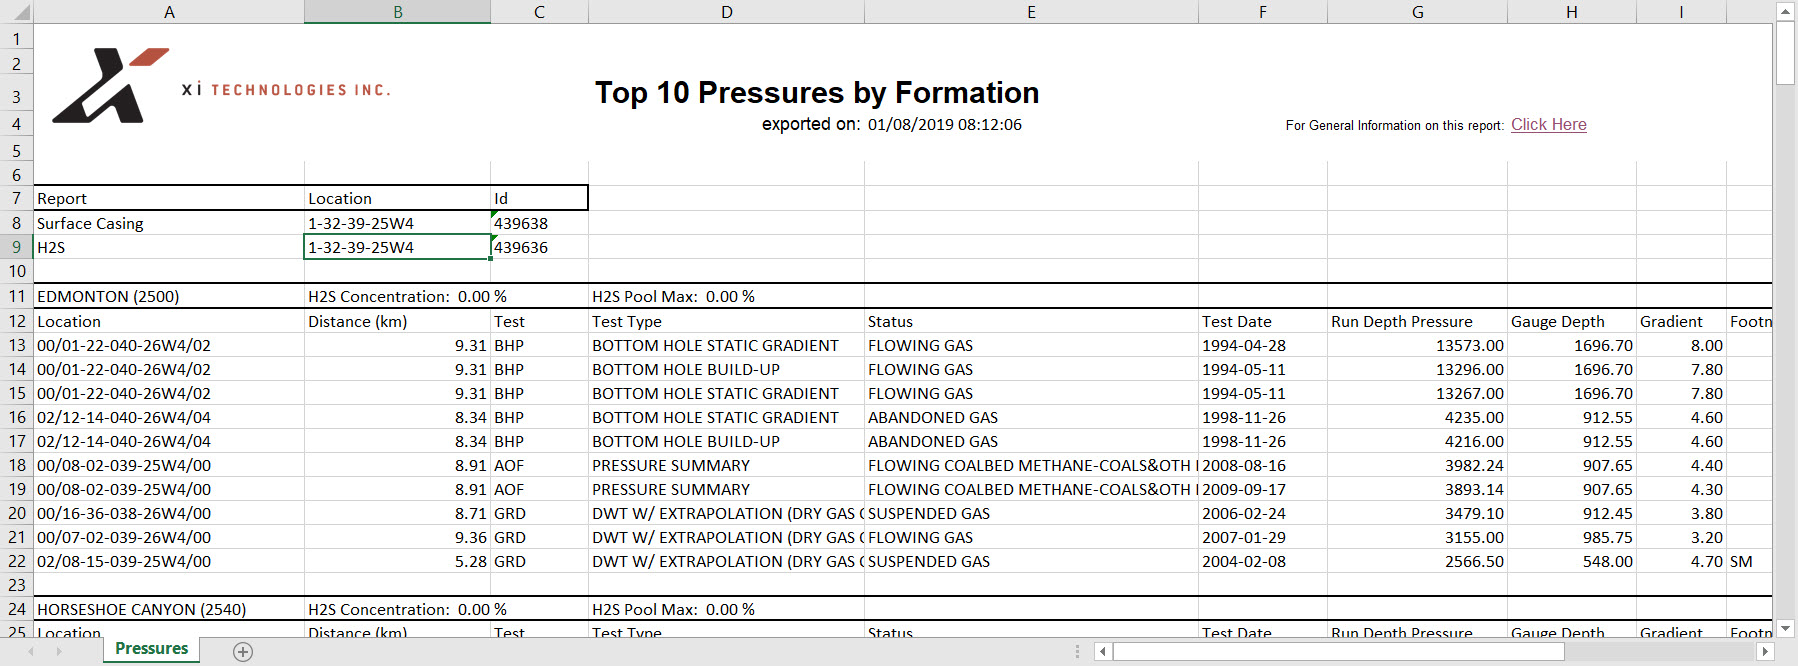
Within the SurfaceCasing Report tool, users can discount tests, move them to the correct formation, and add footnotes. Preparing to generate the beginning information for a STICK diagram is as simple as clicking on the “View Backup Data” button to access a view of the pressures information, then clicking Export. The system allows users to select either the Top 10 (Run Depth Pressure) or Top 10 (Gradient) then link to an H2S Report that can also be generated in XI’s RegulatorySuite.

For those who don’t wish to link to an H2S Report, it is still possible to generate the STICK data download but the H2S concentrations will show as “Not Available”. For convenience, the download will exclude any discounted tests, leaving you with a listing of the top 10 tests which are relevant to your STICK diagram creation (and also the H2S Concentrations if you choose this option).

XI Technologies Inc. has been providing specialized, enhanced data and reports to the oil and gas industry for more than 15 years. We help companies to avoid noncompliance issues in order to streamline approvals and keep work flowing smoothly.