Revisiting the Pembina Oil Field – Area Snapshot
July 30, 2024
This week, we’re spotlighting one of Canada’s largest and historically significant conventional oil fields: the Pembina. A primarily Cardium Oil play around Drayton Valley, this field has been a cornerstone of Canada’s oil production since it began operations in 1953. Below we can see that 70% of Western Canada’s production comes from the top 20 government defined fields. The predominance of the oil sands (drilled) and the large liquid heavy plays in BC are evident.

We last reviewed the Pembina in May 2022, and since then, activity in the field continues to be pivotal for the Western Canadian Sedimentary Basin (WCSB). The Pembina remains a critical asset in the portfolios of several prominent oil companies. Today, we’ll delve into updated insights using enriched data from XI Technologies to provide a current perspective on the Pembina field.
Ownership in Pembina Assets
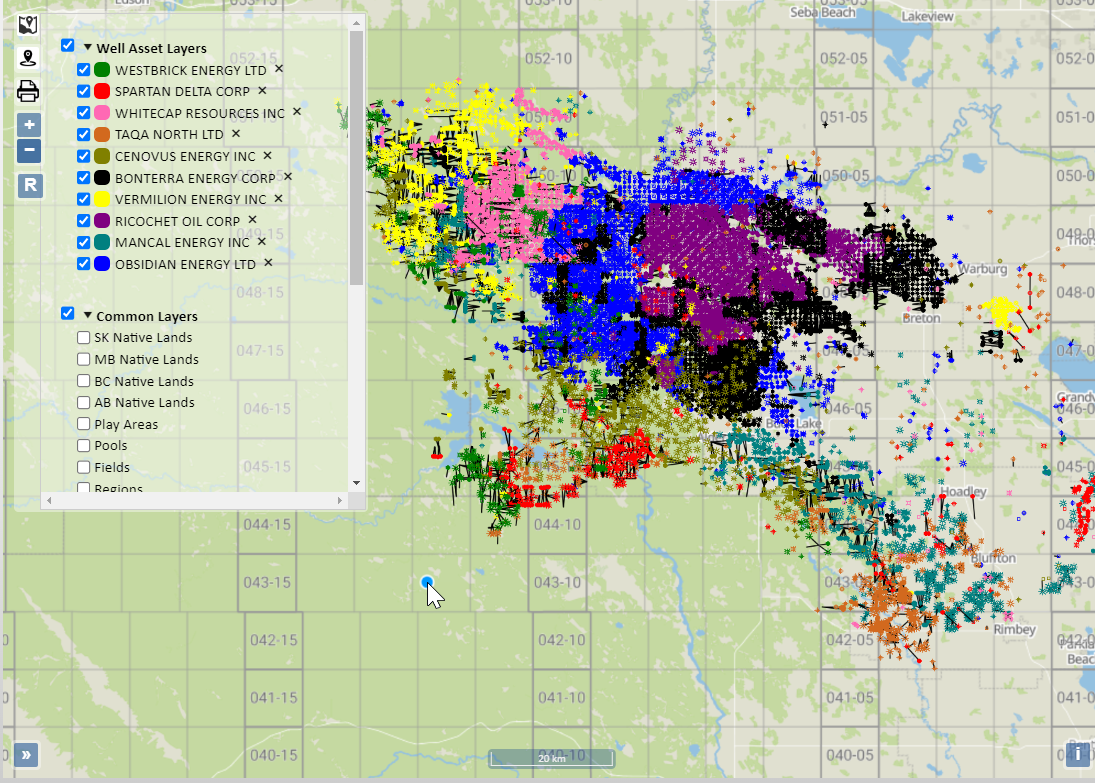
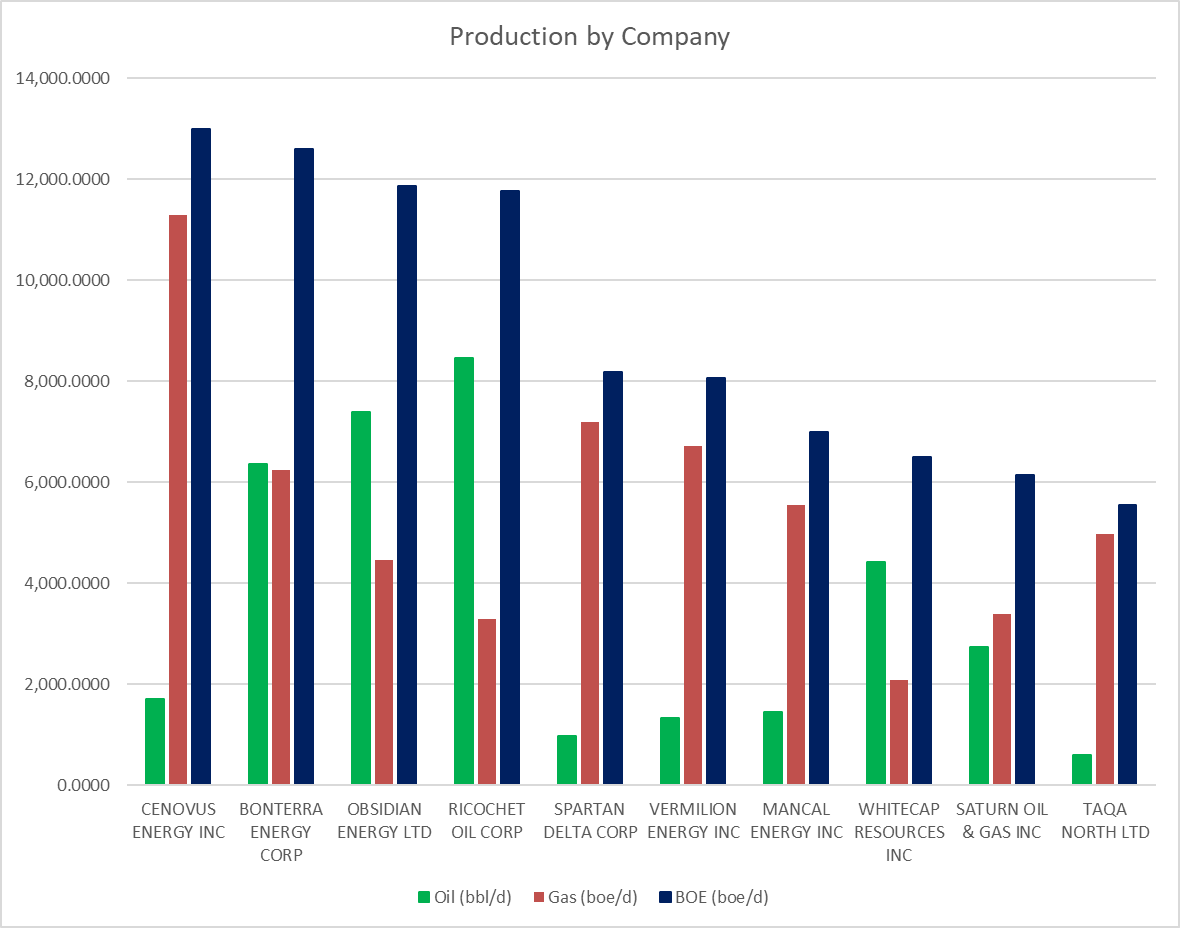
There has been a little consolidation in Pembina since our last article. Now there are 60 companies with 50% or more of their production coming from the Pembina and 16 companies own 85% of Pembina assets. There are a total of 153 companies with production or injection in this area. The Top 10 have changed slightly since our last article. Here are a few graphs to show you the production breakdown for these companies.

Click here to download a report of all companies in the Pembina.
Pembina zones
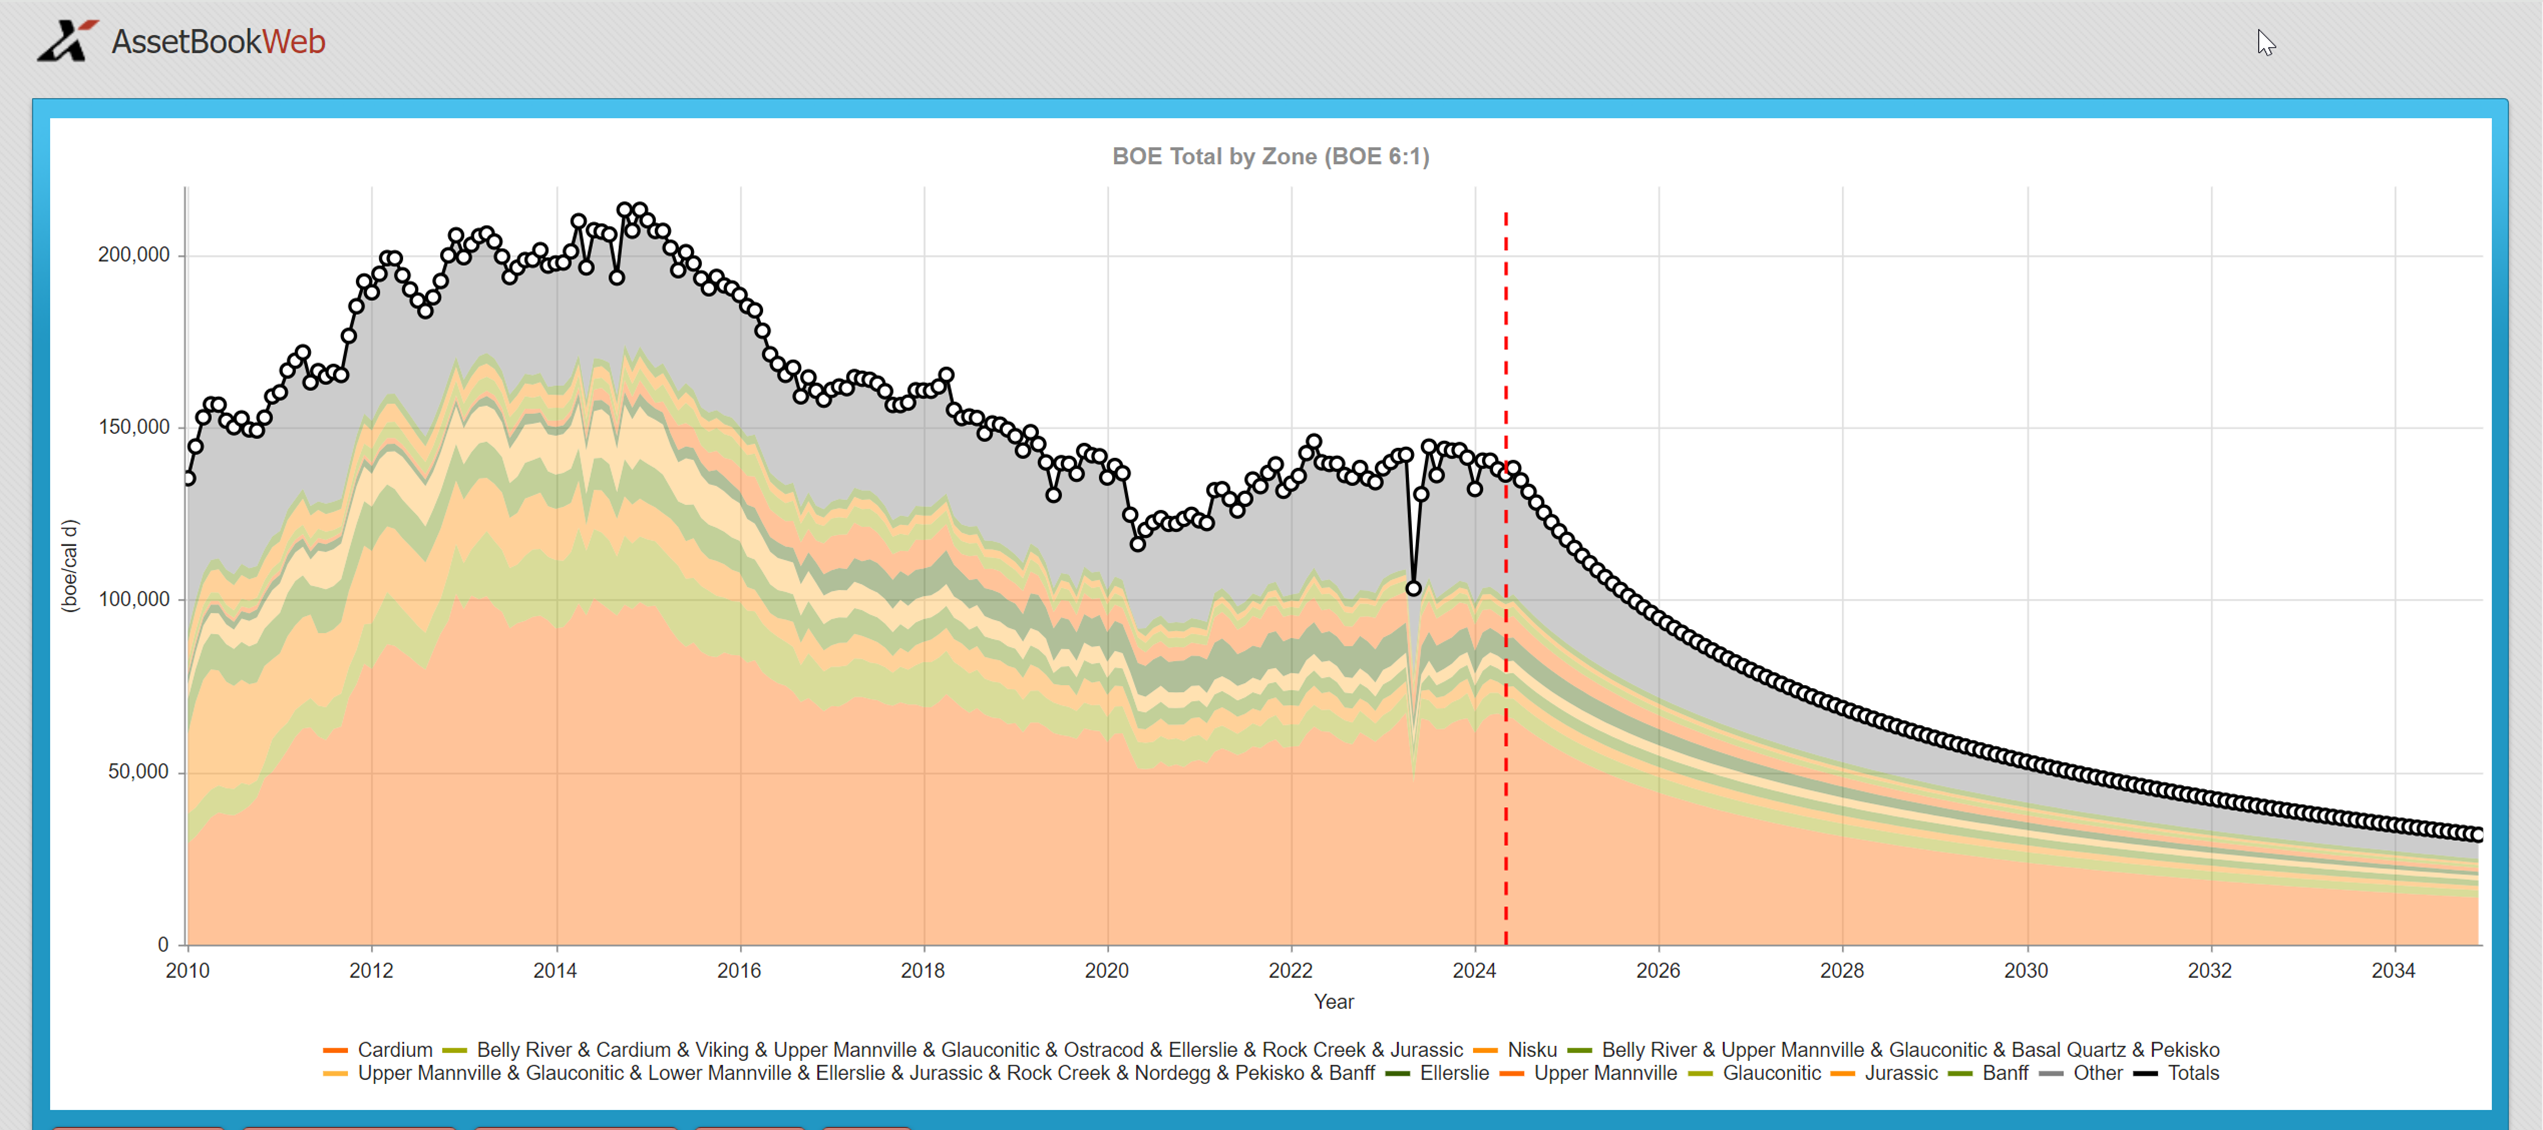
Nearly half of all production in the Pembina comes from what the government has labeled the Cardium area. The figure below charts production of zones in the Pembina.
Production history of Pembina assets
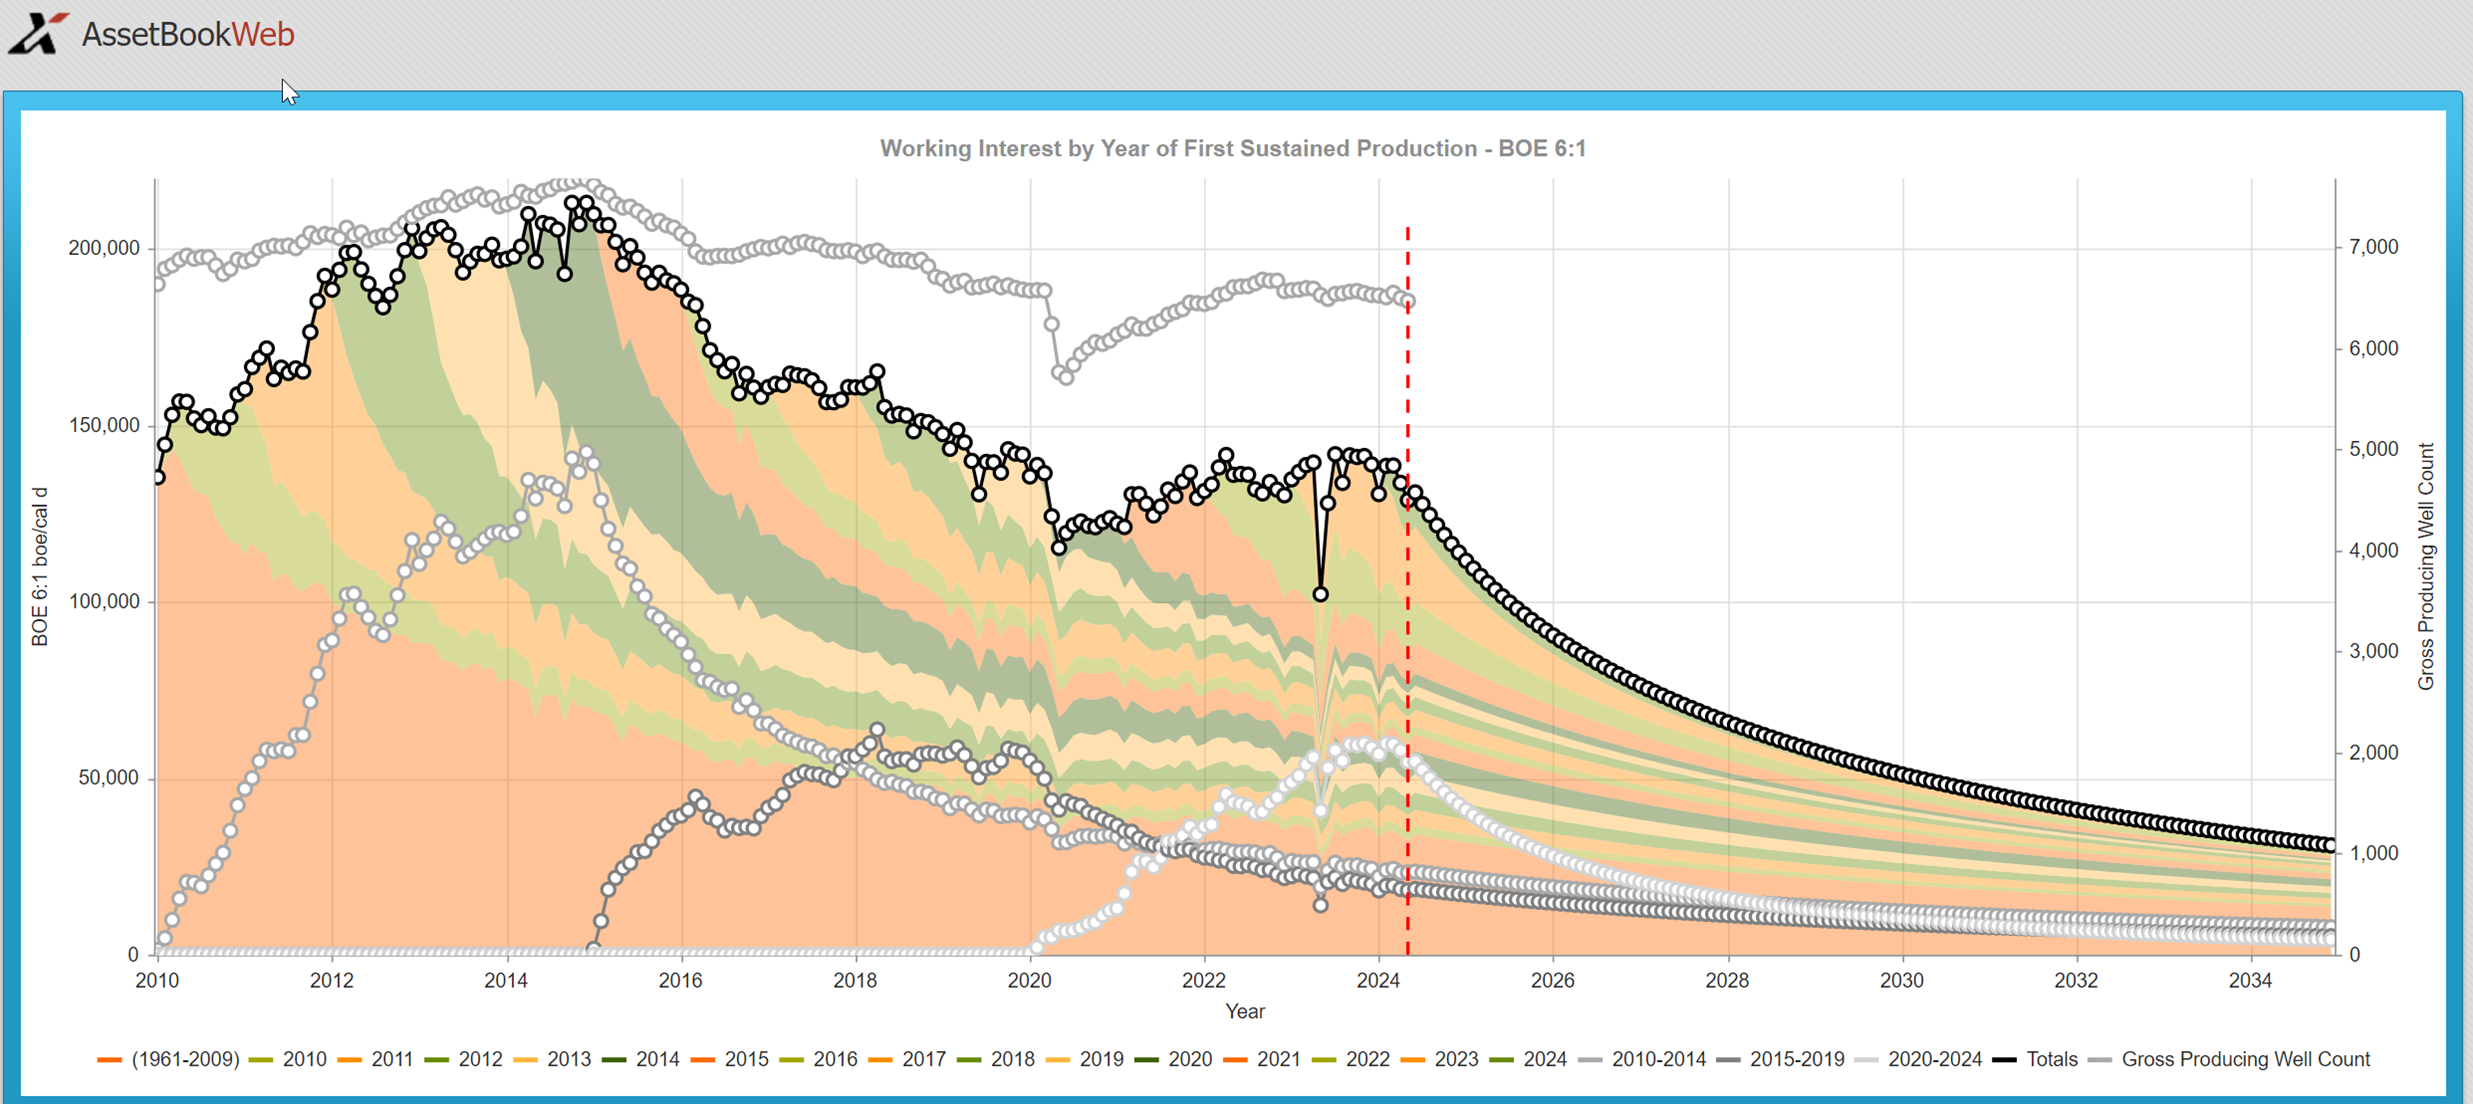
Let’s investigate the Pembina field a little further. Looking at the vintage of this production, it’s confirmed that most activity in the Pembina is legacy with a good percentage of the production coming from pre-2006 wells. However, as the graph shows, 2021 and continued saw a resurgence in production in the field.
Liabilities in the Pembina
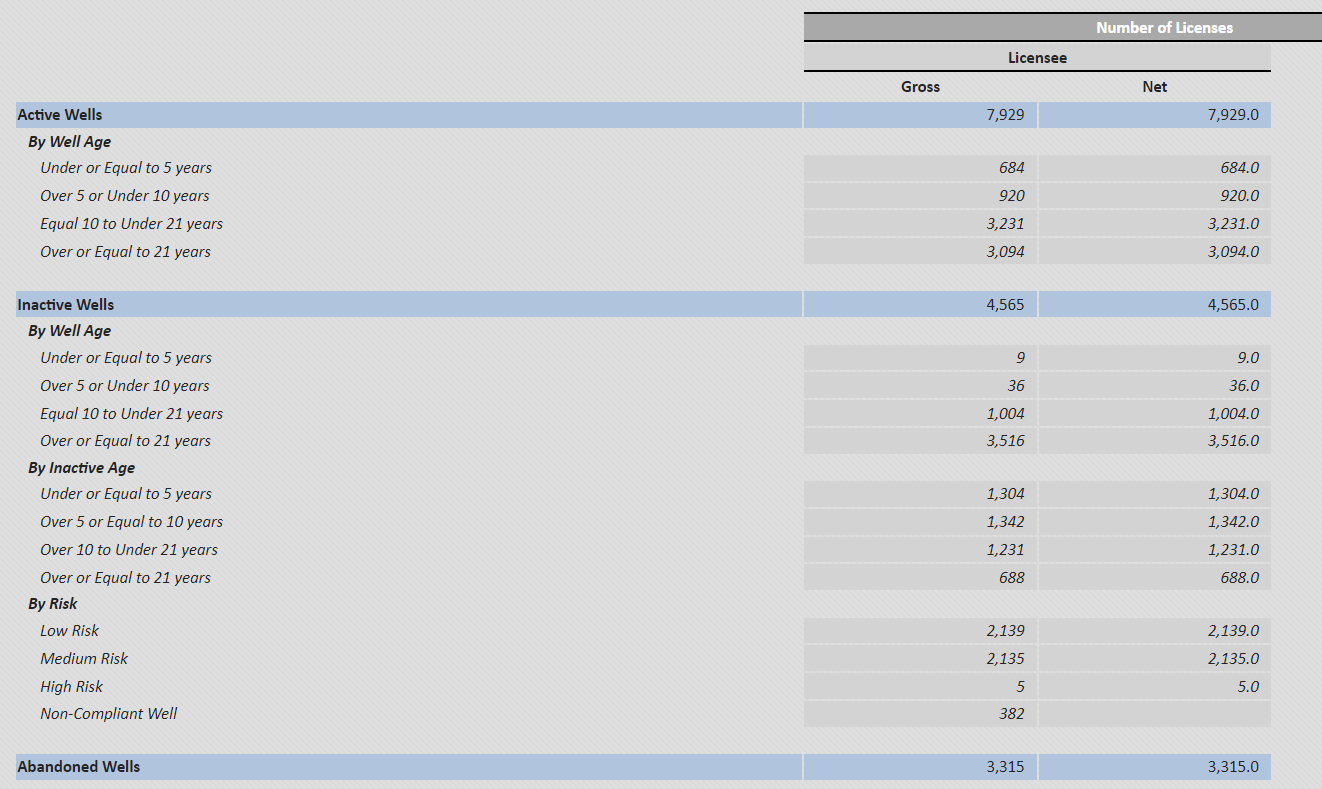
Because this production is older, the ARO Obligations become extremely important. If companies are hoping to acquire rich and long-lived Pembina assets, it is essential to look at liabilities among various acquisition opportunities to determine differences in future obligations.
Being one of the oldest fields in Alberta, it’s no surprise there are a significant number of inactive wells in the Pembina, particularly ones over 21 years in age. Using the new AER Directive 11 numbers the liability in this field for inactive wells is over $561 million or 4565 total inactive wells identified by the government. This is a significant drop from 5234 which was our last report in May of 2022.
Note: Liability costs are based on the AER Directive 11 cost model.
Click here to download an ARO report on the Pembina.
Emissions in the Pembina
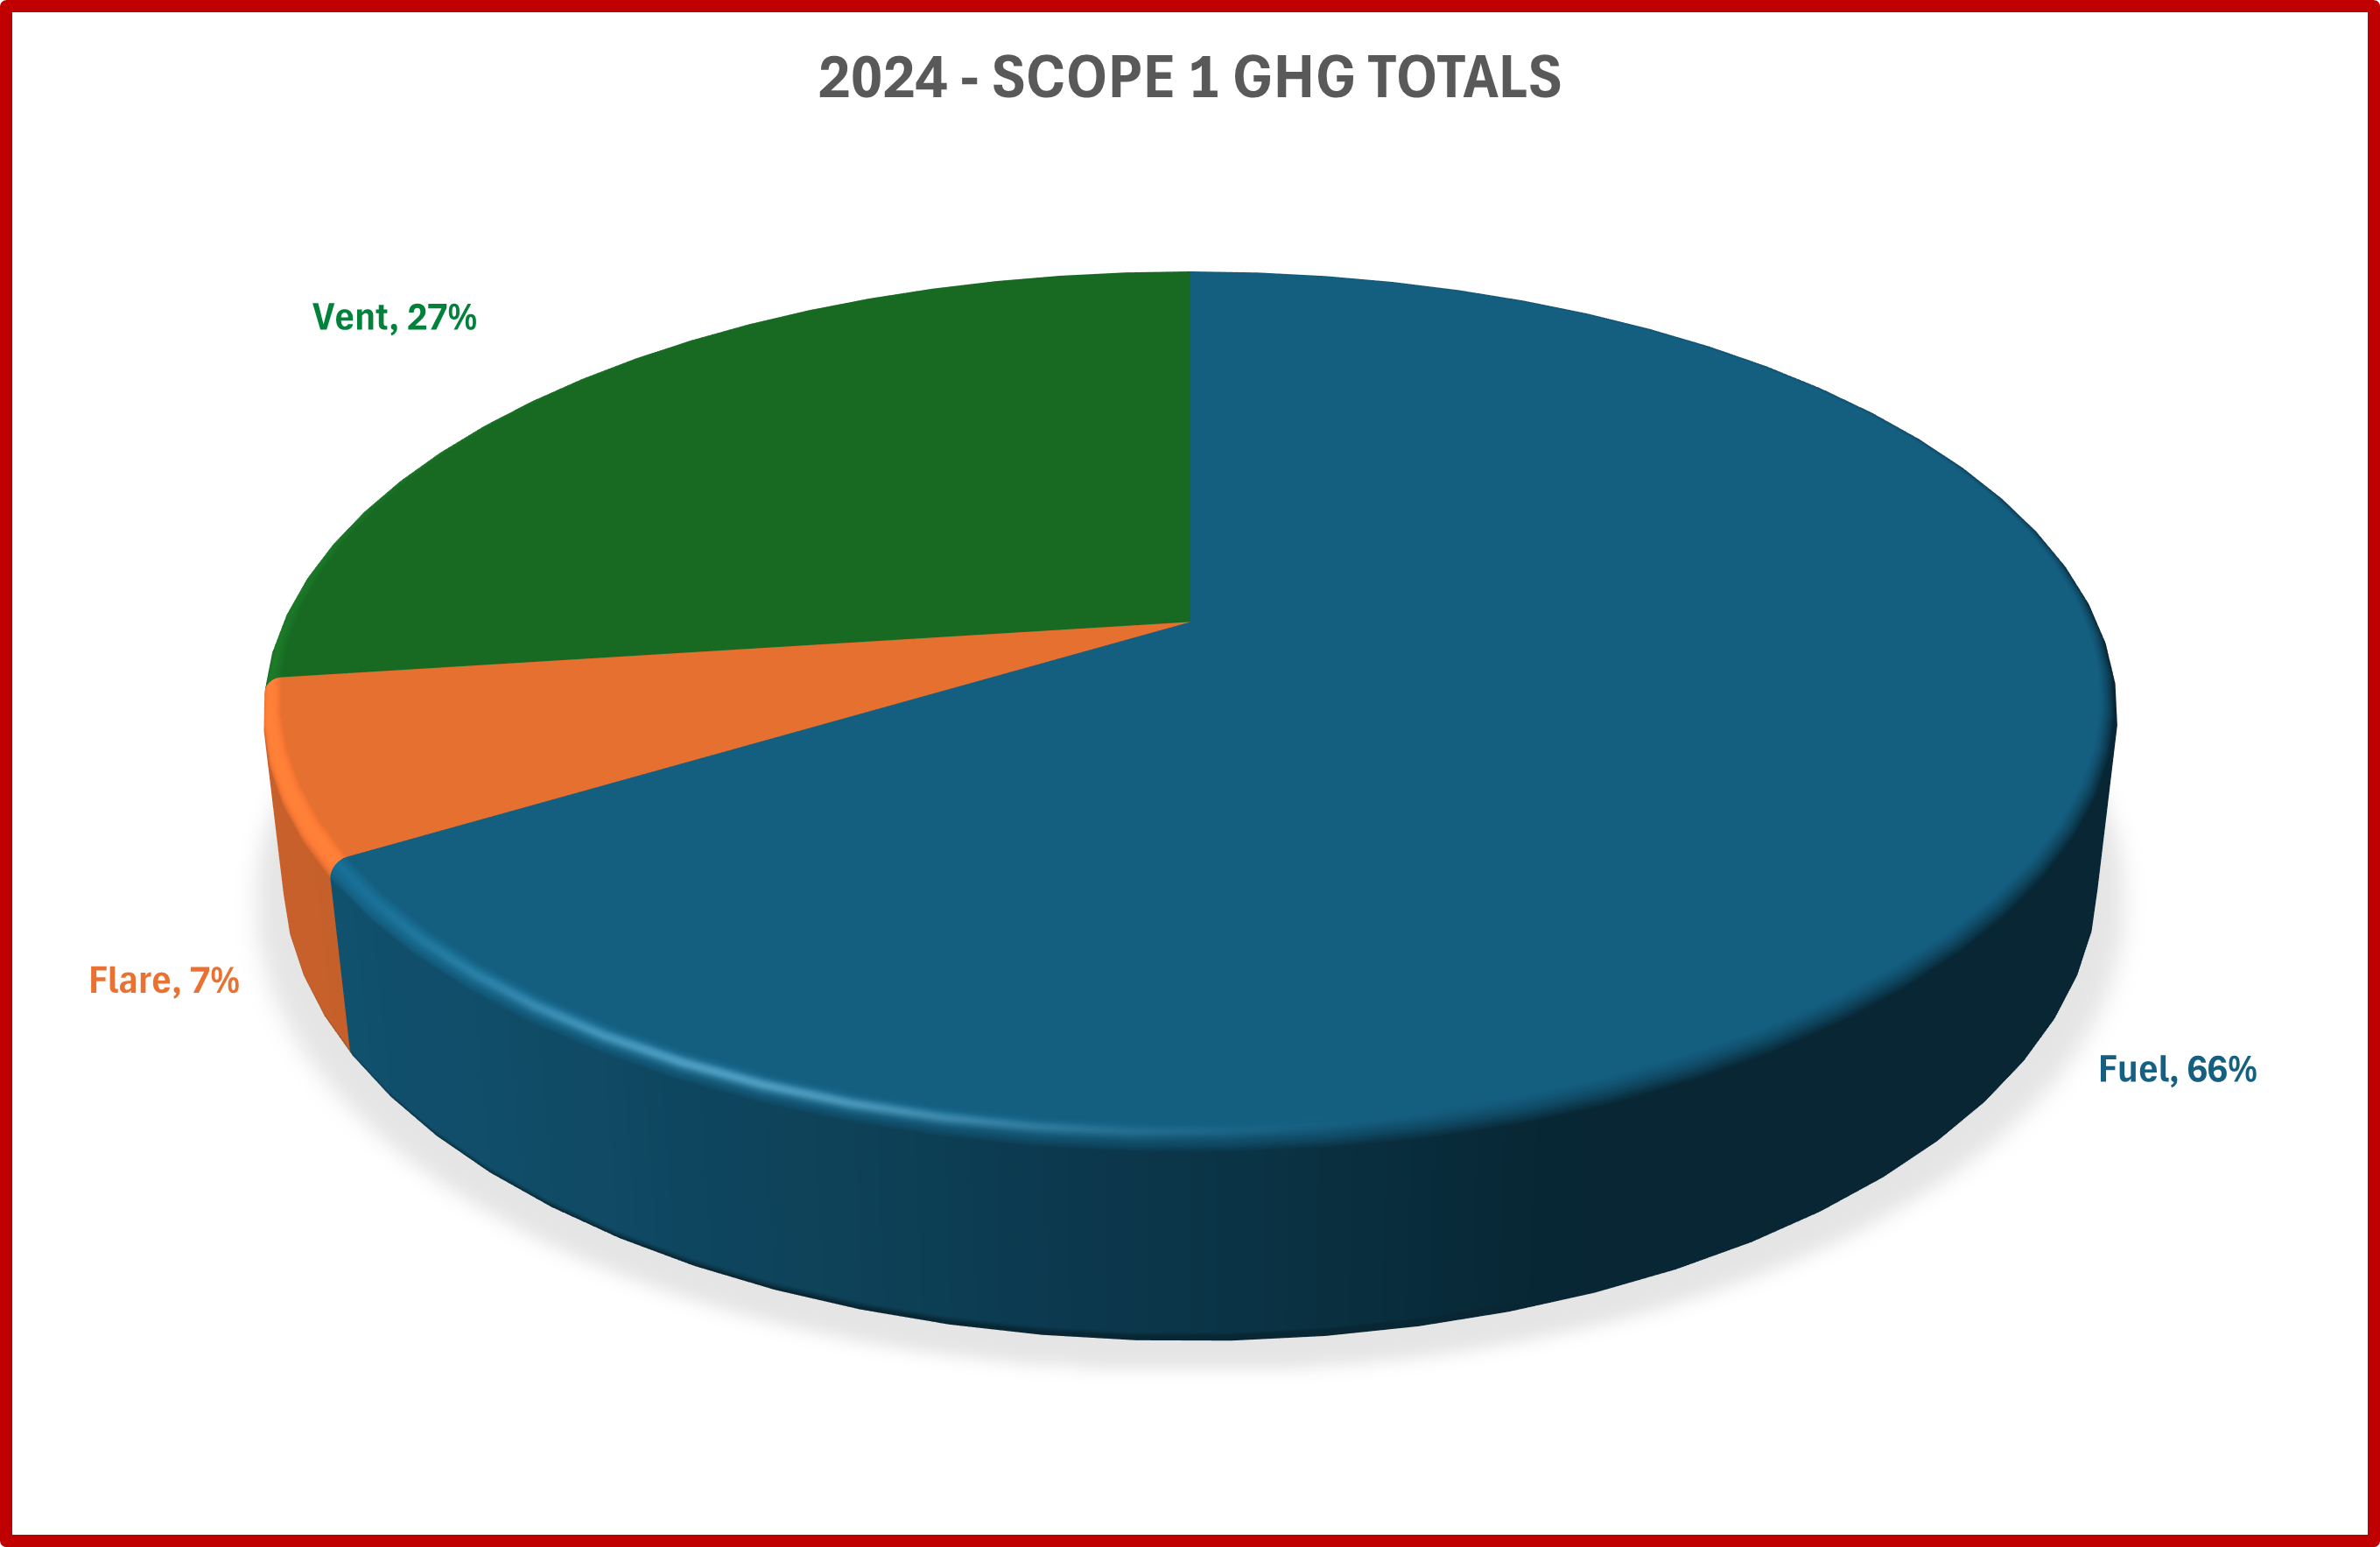
In our last Pembina Area overview in May 2022, our emissions snapshot of Scope 1 GHG Emissions (fuel, flare, vent emissions) from the AssetBook Emissions Report noted a field total of approximately 900k tonnes CO2e over the trailing 12 months, with 40% of the emissions coming from the 10 largest gas plants or gathering systems in the area, all operated by larger midstream or E&P companies. We had also noted that the mature oil field had an impressive 97% conservation rate, with only 3% of the gas produced ended up as emissions. The area break down by fuel, flare and vent emissions was: 77% fuel, 17% vented, and 6% from flaring.
Looking at a current snapshot, we’ve noticed the trailing 12-month scope 1 GHG emissions have dropped by roughly 8000 tonnes CO2e. Interestingly, the top 10 plants now account for only 32% of the total scope 1 emissions. The current conservation rate has dropped from 97% to approximately 92%, and the area breakdown by fuel, flare, and vent has changed significantly, with an increase in venting: 66% fuel emissions, 27% vent, and 7% from flaring. Of note, venting in the area has increased* by 10% of total emissions.
*While interesting, some of these changes may be due to changes in government fuel/flare/vent definitions and submission requirements since our last reporting.

The Pembina Oil Field continues to stand as a pillar in Canada’s energy landscape, maintaining its critical role within the Western Canadian Sedimentary Basin (WCSB). Since our last overview in May 2022, the field’s historical significance remains evident, with the majority of its production coming from legacy wells while new production gains momentum. Despite consolidation among companies, the Pembina remains a lucrative asset for many, with a notable concentration of production and ownership among a few key players.
As we navigate the complexities of the Pembina Oil Field, its resilience and adaptability continue to drive its prominence. The data provided herein offers a snapshot of a field that, despite its age and legacy, remains vital to Canada’s oil production landscape.
Each week, XI Technologies uncovers trends and insights using our enhanced data and software focused on the WCSB. If you’d like Word to the Wise delivered directly to your inbox, subscribe here. For more tips and to learn about how XI’s AssetSuite can help with your high-level analysis visit XI’s website or contact XI for a demo.