Land Insights You Can’t Unsee
January 29, 2026
Most teams don’t struggle because they lack data. They struggle because the signals that matter are scattered across spreadsheets, screenshots, and disconnected tools.
With AssetBook Graphs, existing data is brought together in a way that makes it useful for real decisions. Without that assembly layer, entire categories of insight stay out of reach, not because the data isn’t there, but because it never shows up in a decision-ready form.
Here are three key places Teams tend to realize benefit with AssetBook Graphs.
Land Intelligence
Land teams are constantly trying to answer a simple question: where is activity happening, and what is likely to happen next?
Without AssetBook Graphs, expiry risk is often identified late, bonus expectations are based on anecdotal information, and teams end up reacting instead of sequencing their work. The underlying decision is always the same, where should we act first?
Graphs can change this by making patterns visible early.
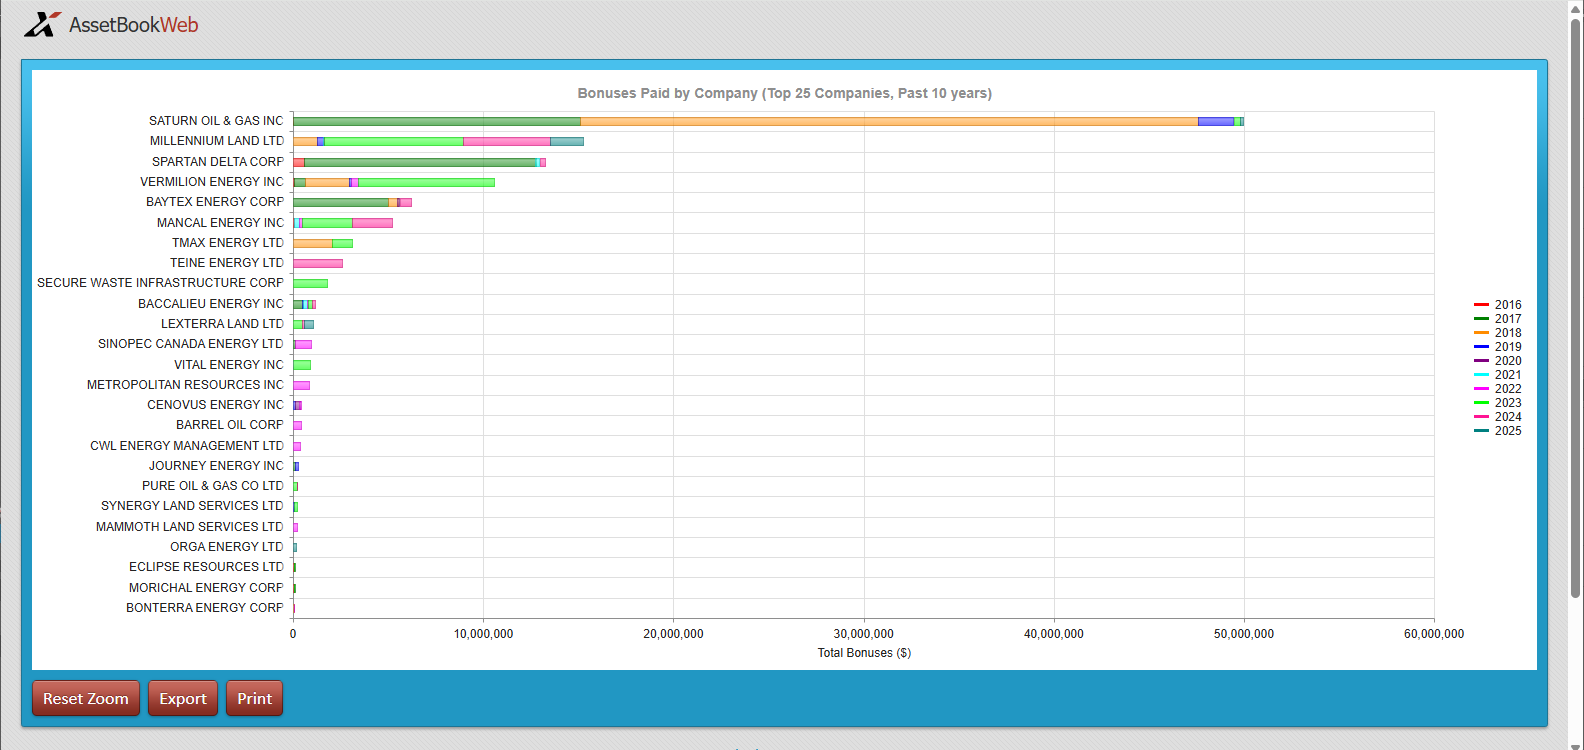
Cumulative bonuses paid by company, year, and area quickly show who is bidding aggressively and where capital is actually flowing. It becomes a practical proxy for market appetite that is grounded in evidence rather than conversation. Interactivity makes it easy to hone in on recent years or perform historical analysis on older years.
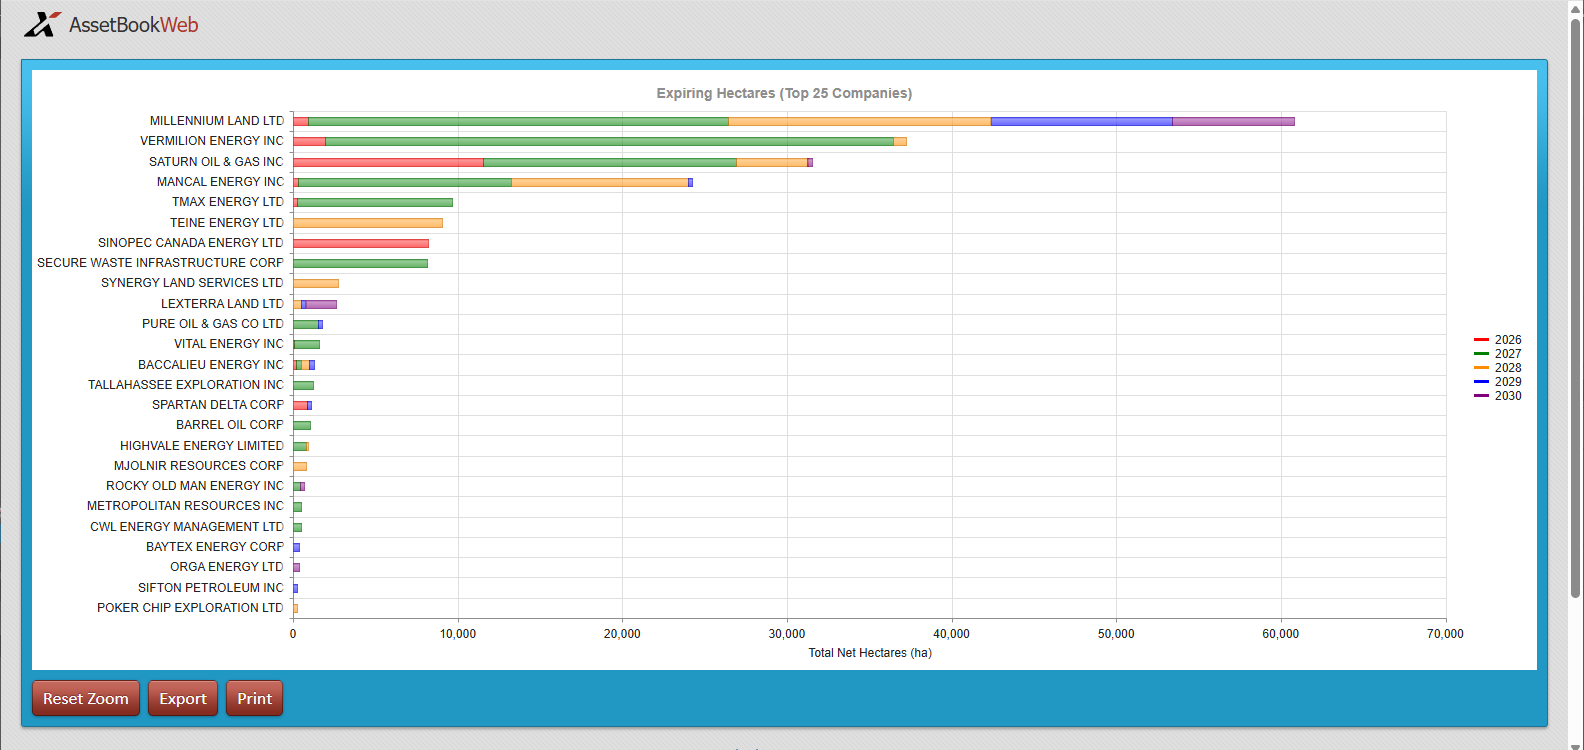
Near-term lease expiries and undeveloped hectares can be surfaced and viewed spatially, which reveals clusters and timing issues, early enough to act. Farm-ins, swaps, extensions, and competitive bids don’t need to be last-minute exercises when you have the information presented properly. The graph below shows the amount of land that each company in the area that is expiring over the next several years and could be a good opportunity for a farm-in.
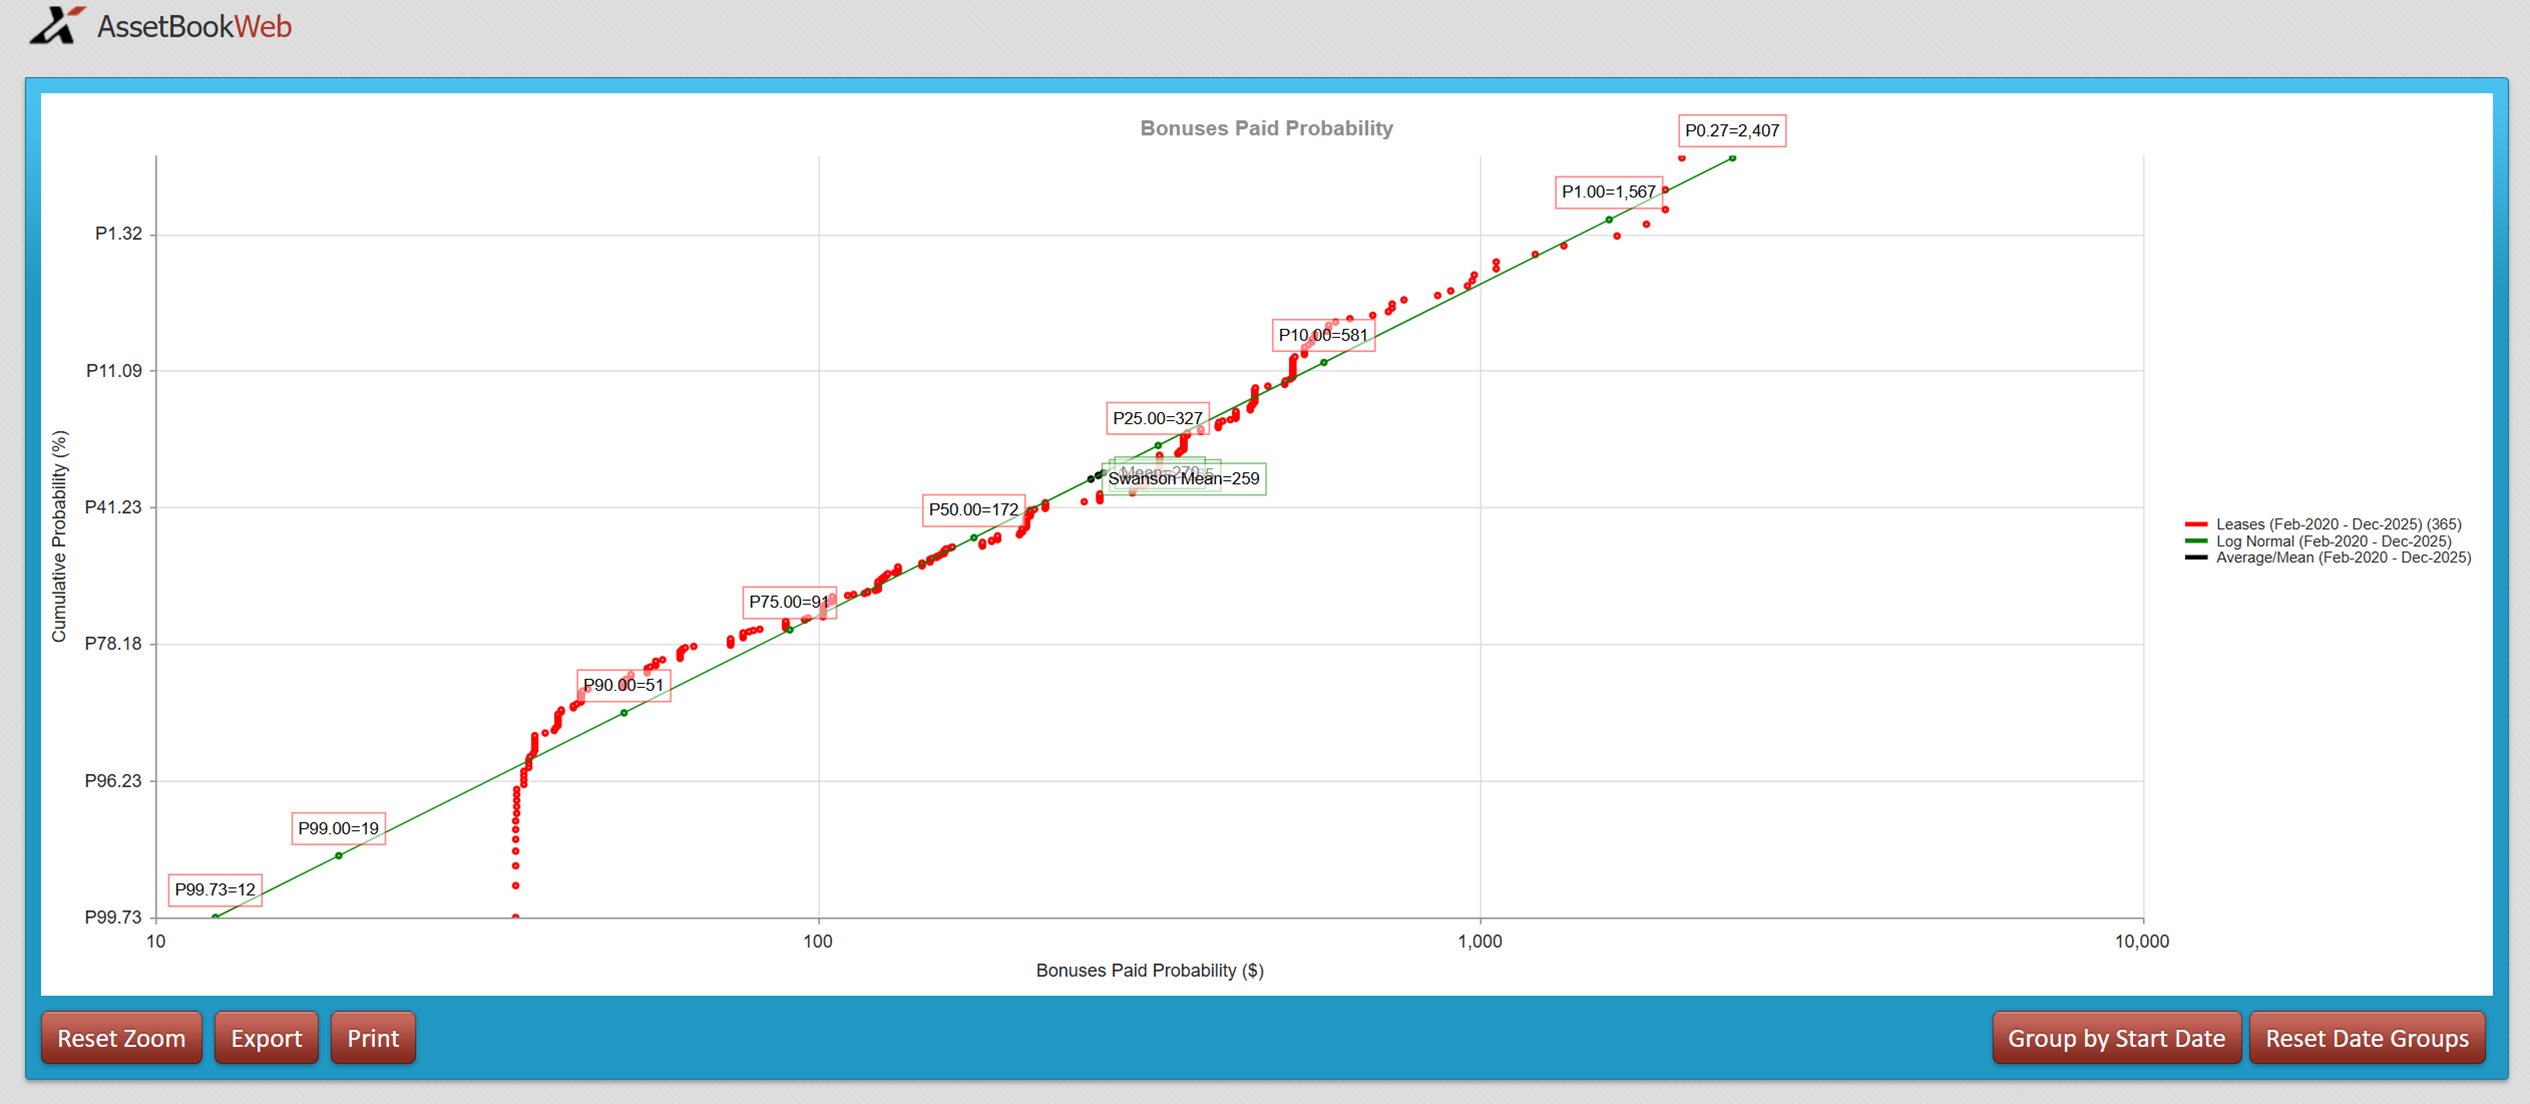
Instead of rebuilding views or guessing what exists, land teams have access to a consistent set of ready-made views that answer the questions they get asked every week. The value is not novelty; it is consistency and defensibility. Statistical analysis can be done with spreadsheets but having a ready-made template allows for better decision making. The graph below shows bonuses ($/ha) paid and the associated averages and probabilities (P10, P50, P90 etc.)
AssetBook Graphs turns everyday land data into decision-ready intelligence. Instead of piecing together spreadsheets or relying on anecdotal market read-throughs, teams get immediate visibility into where activity is happening, where risk is building, and where opportunity is emerging. For subscribers, these insights are part of the daily workflow. For AssetBook Graphs non-subscribers, they remain hidden in disconnected data. If your team is still reacting to land outcomes instead of shaping them, it may be time to see what AssetBook Graphs makes visible.
See the Insights Before the Market Moves
Join us for the AssetBook Graphs Webinar, where we’ll walk through real-world land intelligence examples.
You’ll learn how to:
- Understand a potential acquisition’s production profile at a glance
- Compare assets and peer groups in seconds
- Identify which fields and zones actually drive production
- Prepare smarter land bids using bonus and probability graphs
- Frame upside and risk with time-slice and probability views
Stop reacting to outcomes. Start shaping them.
Register now for the Graphs Webinar – February 11 at 9:00 AM