Area of a Deal: Understanding the Players in an Area
June 19, 2024
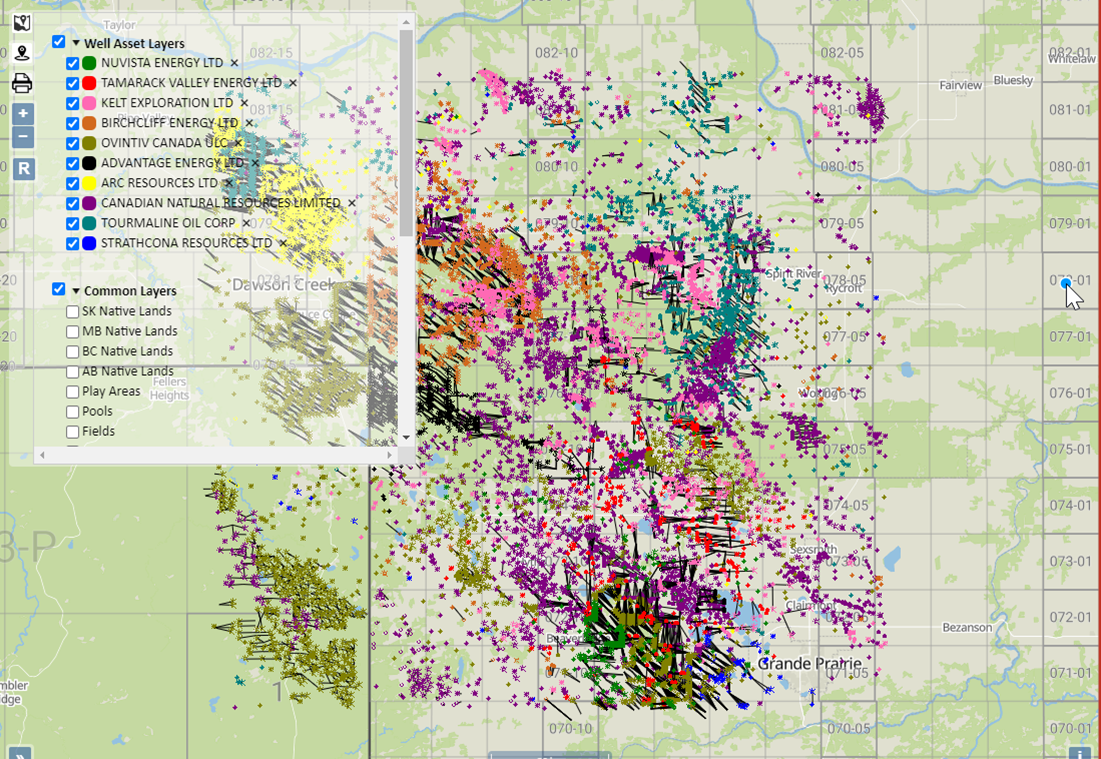
Area Overview: Location of Advantage Energy Recent Acquisition
Advantage Energy’s recent acquisition of Longshore assets marks a significant milestone in its growth trajectory, enhancing its position in a prolific production area. This blog delves into the details of this area.
1. Production Capacity:
-
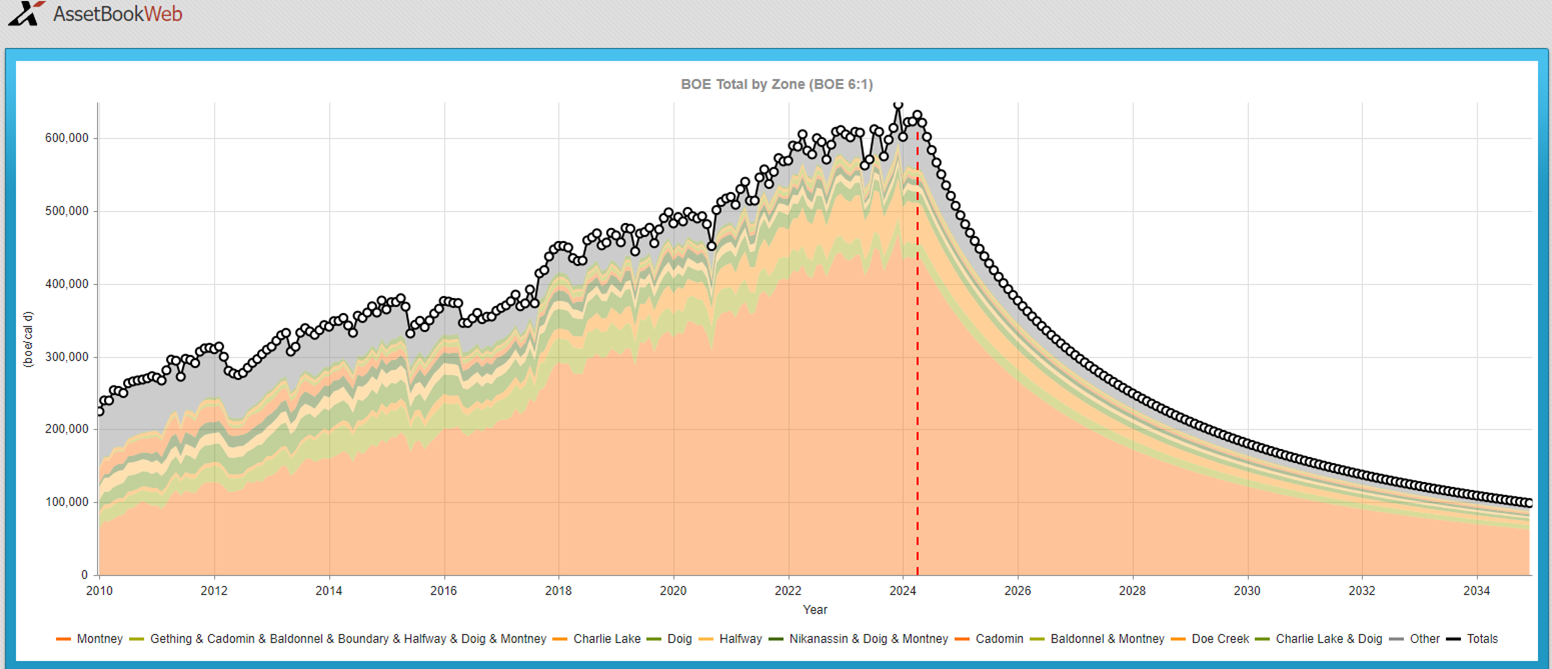
- The total production of the area is approximately 642,751 barrels of oil equivalent per day (boe/d), calculated using a conservative 6:1 gas-to-oil conversion ratio. This area is known for its rich hydrocarbon deposits and significant production capabilities.
- Oil is 12.34% of the production in this area, and we know it is liquid rich meaning our 6:1 gas to oil ratio underestimates the BOE total
- Of the top 10 companies, NuVista Energy Ltd has the highest Average Well rate at 292 boe/d.
- Of the top 10 companies, Kelt Exploration Ltd has the highest Undeveloped land ratio at 2.27.
- Ovintiv Canada ULC, Arc Resources Ltd and Tourmaline Oil Corp have been the most prolific in the area drilling 62, 48.4 and 42.23 net wells respectively in the past 12 months.
2. Predominantly Montney Production in the Area:
-
- The overall area is predominantly focused on Montney production, which constitutes over 70% of the total production. Montney is renowned for its rich hydrocarbon deposits, making it a valuable asset for any energy company operating in the region.
- The specific assets acquired by Advantage Energy Ltd are from the Charlie Lake formation; this formation accounts for 8.85% of the area’s production. This translates to approximately 56,898.87 boe/d.
- The area also includes a significant amount of currently undefined production, totaling 39,636.70 boe/d. This is split into 1,580 boe/d from Charlie Lake and 28,233 boe/d from Montney, with the remainder coming from other sources.
3. Competitive Landscape:
-
- The area hosts 427 producing companies, with 80% of the production controlled by the top seven companies. The acquisition of Longshore assets propels Advantage into second place in terms of production, highlighting the strategic importance of this deal.
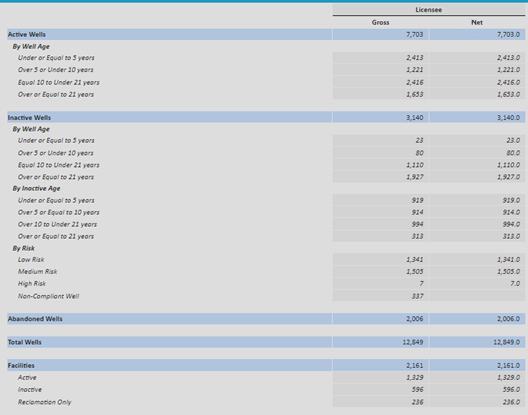
4. Liability Landscape:
-
- Using the current XI Cost Model, the liabilities in this are equal 1,625,309,593.
Conclusion
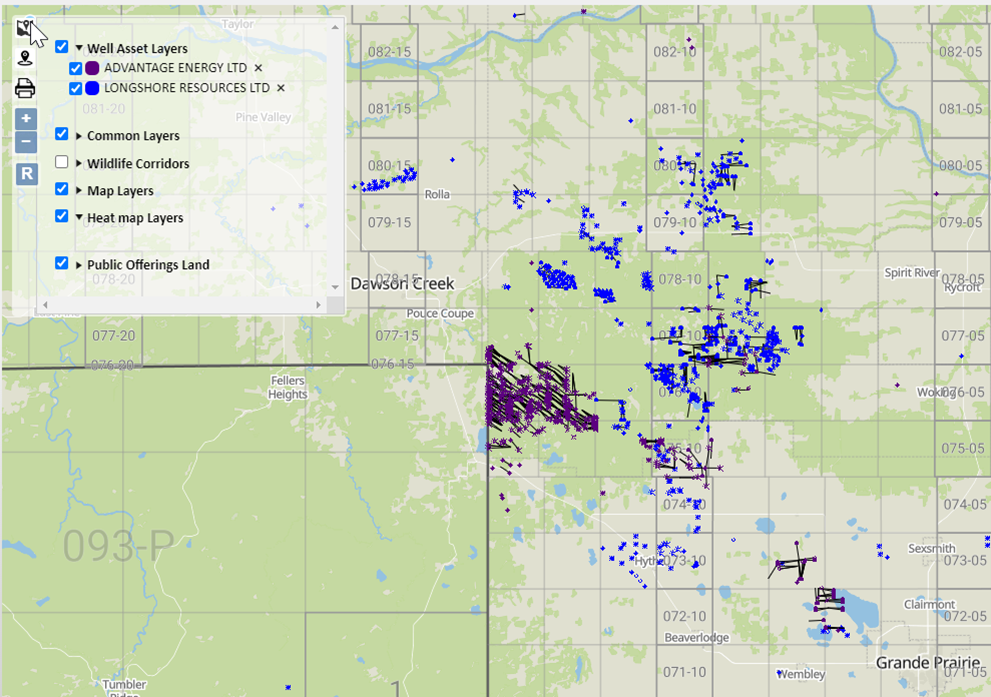
The acquisition of Longshore assets represents a strategic coup for Advantage Energy, significantly enhancing its production capabilities and market position. With a strong focus on Charlie Lake production, coupled with opportunities for further exploration, Advantage is well-positioned for sustained growth and competitive advantage in the energy sector. Looking at fit with Advantage you can see from the map below that these assets flow right into where Advantage have a play in 76-13W6 and 76-12W6.
As the industry evolves, such strategic acquisitions will be pivotal in shaping the future landscape of oil and gas production. Advantage Energy’s proactive approach and strategic foresight ensure it remains at the forefront of this dynamic and vital sector.
—
Each week, XI Technologies uncovers trends and insights using our enhanced data and software focused on the WCSB. If you’d like Word to the Wise delivered directly to your inbox, subscribe here. For more tips and to learn about how XI’s AssetSuite can help with your high-level analysis visit XI’s website or contact XI for a demo.