Word To The Wise: Decoding Emission Trends – A Peek into Alberta’s Oil and Gas Sector
January 23, 2024
The oil and gas sector has long been a focal point in the global conversation on climate change, and governments are increasingly taking steps to regulate and reduce emissions. Recently, the Canadian Federal Government unveiled its proposed regulatory framework aimed at capping emissions in the oil and gas sector, with the ambitious goal of achieving net-zero emissions by 2050
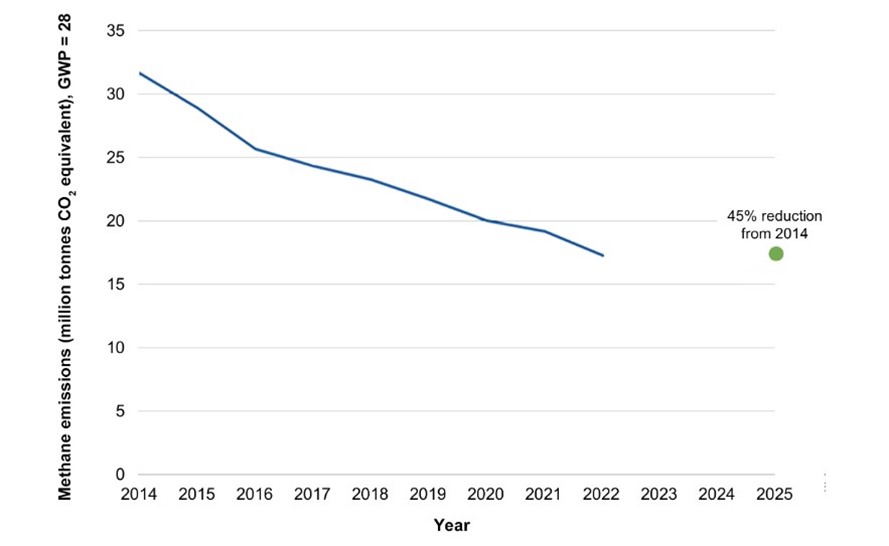
In early January 2024, the AER published their updated Methane-Emissions package, including an updated Upstream Petroleum Industry Emissions Report (ST-60B). The report is a summary of performance for the year ending December 31, 2022, breaking down fuel, flare, vent, and fugitive emissions (including source specific emissions). Accompanying the report, the Methane Performance report brought attention to this fact:
Alberta has achieved the Government’s goal of a 45% reduction in methane emissions from the 2014 baseline, reaching this milestone two years ahead of the 2025 deadline.

The latest Alberta regulator reporting is only current until 2022. How are individual companies in Alberta currently responding to these mandates? Let’s delve into the emissions trends over the last three years, with a focus on intermediate peer group companies.
Unveiling the Data: Alberta’s Emissions Landscape
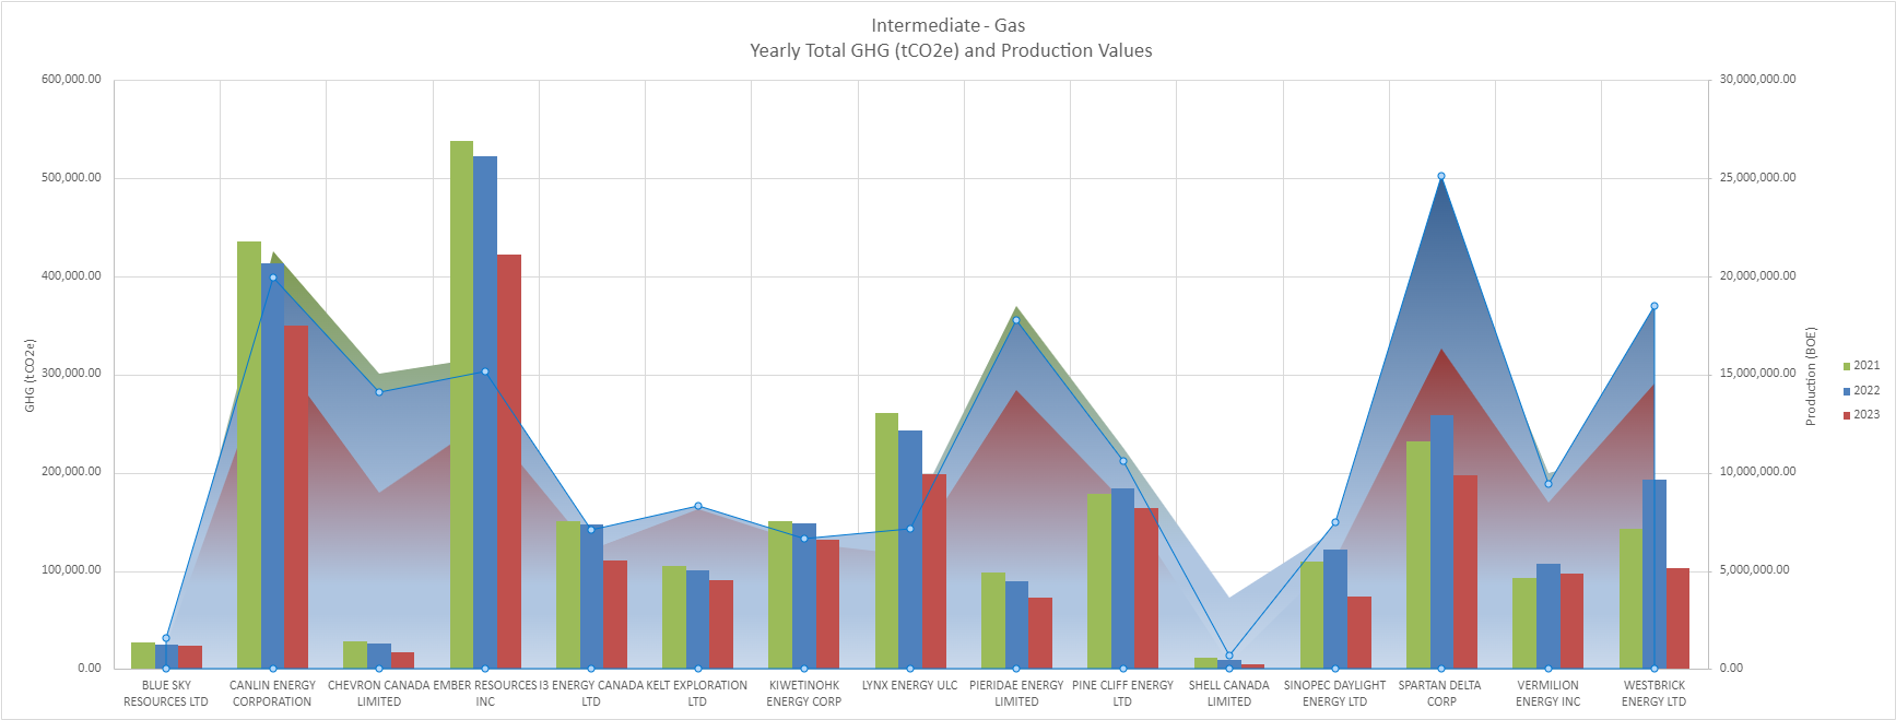
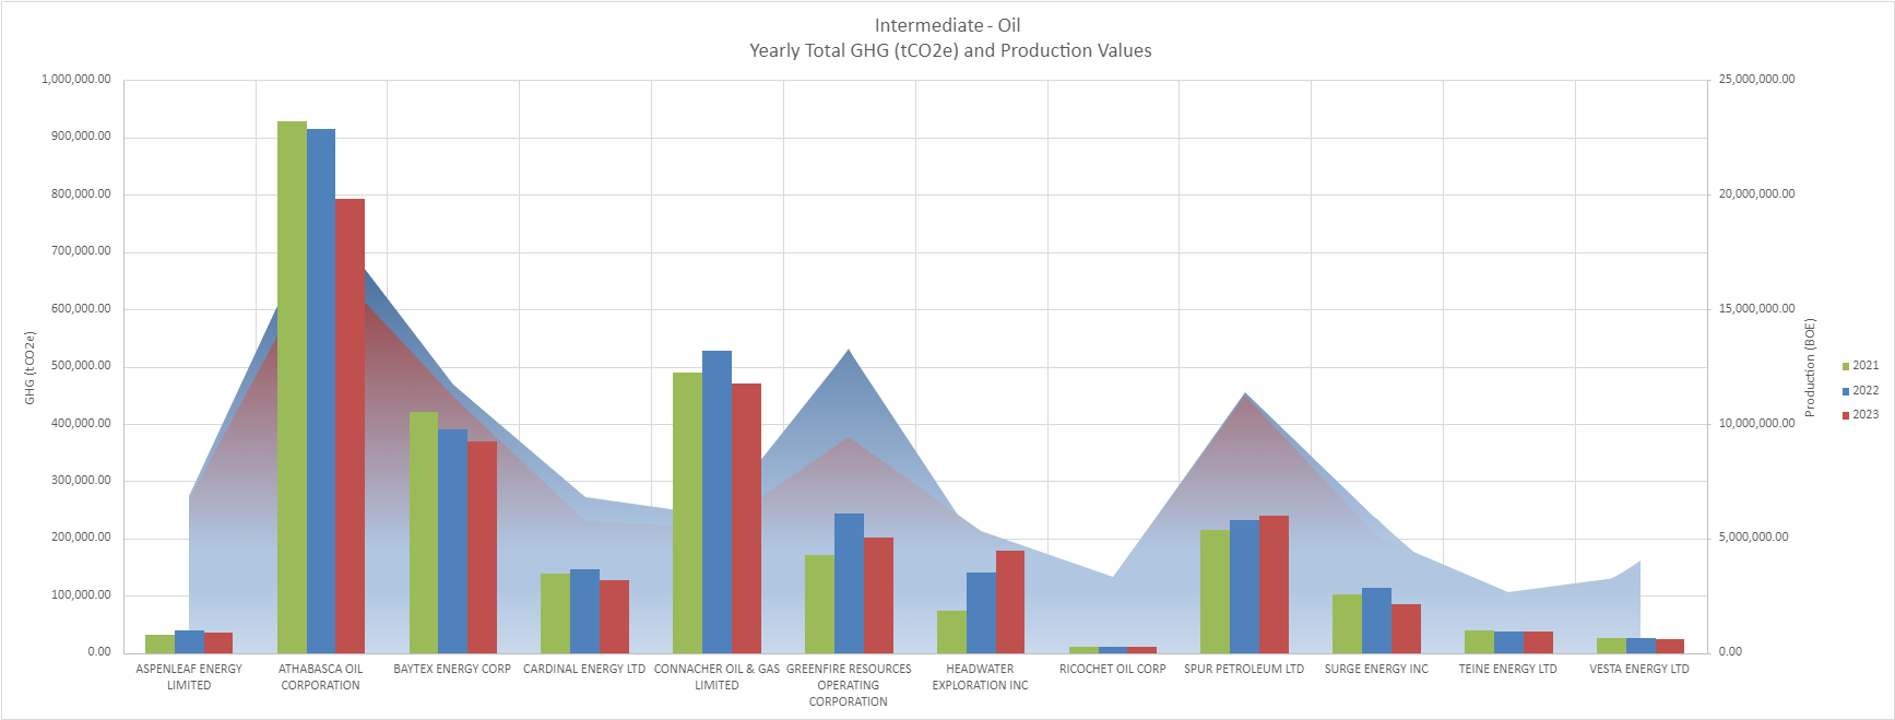
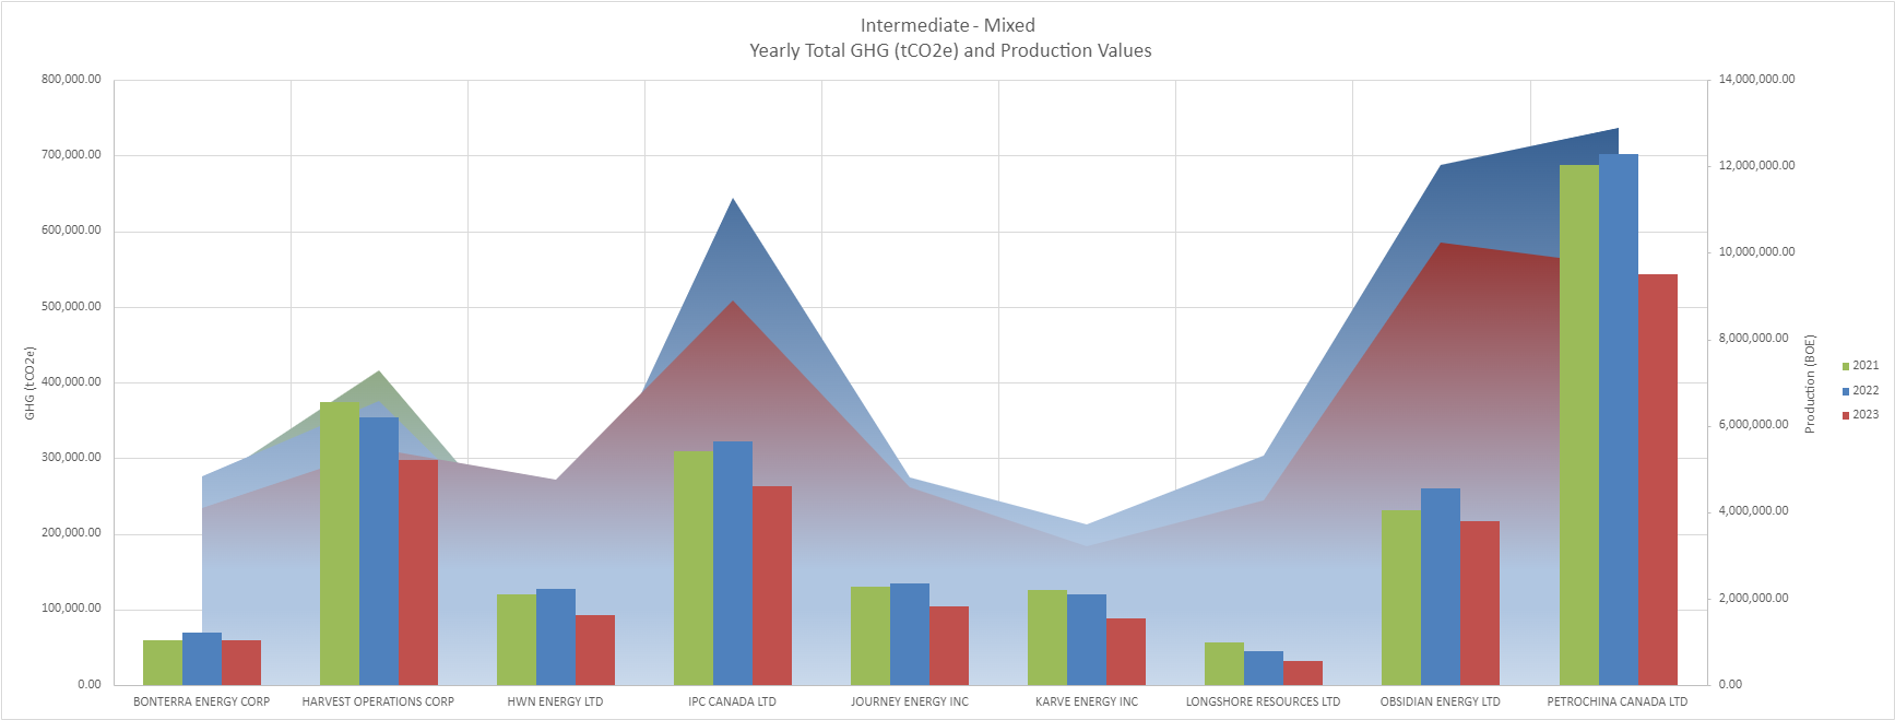
Three distinct graphs, representing intermediate peer group companies, shed light on the reported Scope 1 emissions (fuel, flare, vent) and production trends in Alberta’s oil and gas sector. These companies are categorized based on their size and primary product type, following the guidelines outlined in Directive 88. The trends are based on an operator’s current asset holdings (as of Nov 2023), with a look back at how they have performed over time.


Puzzling Disparities: Efficiency or Selective Operations?
A notable observation is the presence of companies with significantly higher production relative to their reported emissions. This raises intriguing questions – are these companies operating more efficiently, or are they not operating their higher emitting facilities?
Understanding the nuances behind these disparities can offer valuable insights into best practices within the industry. It might signify innovative approaches to emissions reduction or indicate areas where operational efficiencies can be replicated across the sector.
The Road Ahead: AssetBook Emissions Analysis
For those keen on exploring this analysis in greater detail or examining different peer groups, AssetSuite offers a comprehensive solution. Whether you desire a deeper dive into the data or wish to explore trends, a demo of AssetBook Emissions could provide the answers you seek.
The evolving landscape of emissions regulations in the oil and gas sector demands a nuanced understanding of individual company efforts. As we move towards a sustainable future, dissecting these graphs and exploring the underlying dynamics becomes crucial in shaping effective regulatory frameworks and industry practices.
Stay tuned for more insights, and don’t hesitate to reach out for a demo if you’re eager to explore the data further.
For more on how you can utilize AssetBook for ARO scenario analysis, emissions, and wells to facilities production chain, into your high-level scoping, join us for our webinar:
AssetBook M&A Workflow in Action – Register Now!
Each week, XI Technologies uncovers trends and insights using our enhanced data and software focused on the WCSB. If you’d like Word to the Wise delivered directly to your inbox, subscribe here. For more tips and to learn about how XI’s AssetSuite can help with your high-level analysis visit XI’s website or contact XI for a demo.