Word to the Wise: A deeper look at industry consolidation since 2018
February 9, 2021
Each week, XI Technologies scans its unique combination of enhanced industry data to provide trends and insights that have value for professionals doing business in the WCSB. If you’d like Wednesday Word to the Wise delivered directly to your inbox, subscribe here.
In this week’s Wednesday Word to the Wise, we examine how much consolidation has taken place in the WCSB since 2018.
We last wrote about industry consolidation in July 2020, covering the period from 2018 to May 2020, looking at the natural industry consolidation in the market. However, we wanted to take a deeper dive into that to see where exactly this consolidation was occurring. What seems to be the “sweet spot” for purchase or mergers?
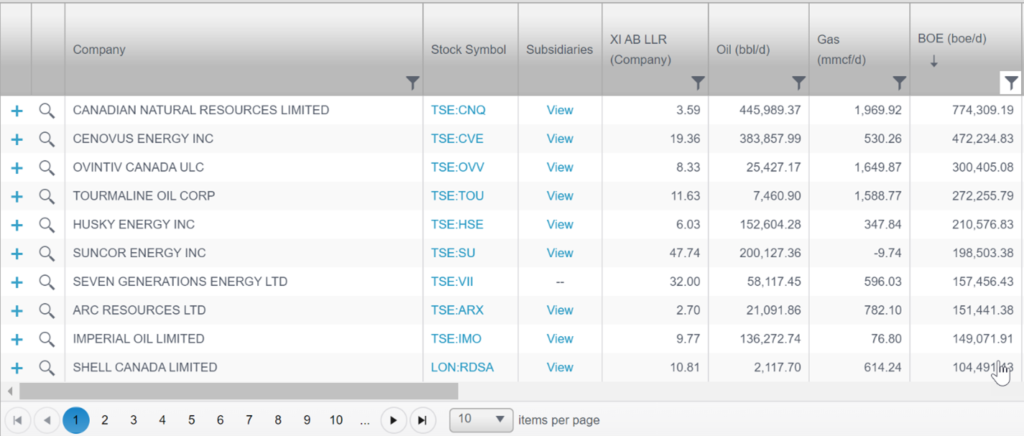
According to the enhanced public data in XI’s AssetBook, in a two-year span (November 2018- November 2020), the number of active companies with reported production in the WCSB shrunk by 12 percent. Active company count (greater than 0 BOE/Day) went from 1,326 in November 2018 to 1,166 at the end of October 2020. (This represents a reduction by 53 companies – or 4% – since we last posted this data).

To get a better sense of what types of companies have been consolidating in recent years, we grouped them into categories by BOE/day. Doing so revealed that the biggest drop in number of companies in terms of percentage occurred with companies over 100,000, which has seen its total reduced by 25%. The next biggest drop in terms of percentage came in the 1-500 BOE/day range and the 500-5000 BOE/day range each dropping 14% (however, the raw totals reveal that the smaller groupings have seen much more volatility, seeing a reduction of 109 and 19 companies respectively, versus the larger grouping going from 12 total in 2018 to 9 in 2020).
The intermediate groups of 5,000-20,000 BOE/day and 20,000 – 100,000 BOE/day had the least percentage change of consolidation over the two-year period, seeing a reduction of 10%. The trend appears to be consolidation of companies under 5,000 and over 100,000 with relative stability between 5,000 and 100,000, which makes sense as companies try to go from Juniors to flip and very large companies try to consolidate for efficiencies.

If you’d like a deeper look into this data or how to get a historical look at industry data, contact us for access to a consolidation report.
Along with reports of several aggressive takeover bids in the market, what this continued consolidation suggests is that acquisition and divestiture is the current order of the day. A lot of this growth is being driven by hidden sales and hostile bids, meaning that companies who want to succeed in this environment need sophisticated intelligence on companies throughout the industry.
XI has the data required to independently evaluate opportunities that become publicly available as well as hidden opportunities that may never hit the public market. To learn how XI’s AssetSuite can help you optimize your M&A process and uncover unadvertised assets, visit our website or contact us for a demo.