Sed diam nonummy nibh euismod tincidunt
Ut laoreet dolore magna aliquam erat volutpat. Ut wisi enim ad minim veniam, quis nostrud exerci tation ullamcorper suscipit lobortis nisl ut aliquip ex ea commodo consequat. Duis autem vel eum iriure dolor in hendrerit in vulputate velit esse molestie consequat, vel illum dolore eu feugiat nulla facilisis at vero eros et accumsan et iusto odio dignissim qui blandit praesent luptatum zzril delenit augue duis dolore te feugait nulla facilisi.
XI Technologies looks at expiring land to provide useful business development intel for both service companies and exploration and production (E&P) companies alike.
For service companies, expiring lands provide insight into where drilling activity is most likely to occur over the coming months, and who is behind it. For E&Ps, the expiring land report helps flag farm-in opportunities and/or land that may become available in your core area(s). According to AssetBook data, these are the top 25 companies with expiring lands in Alberta over the next 12 months:
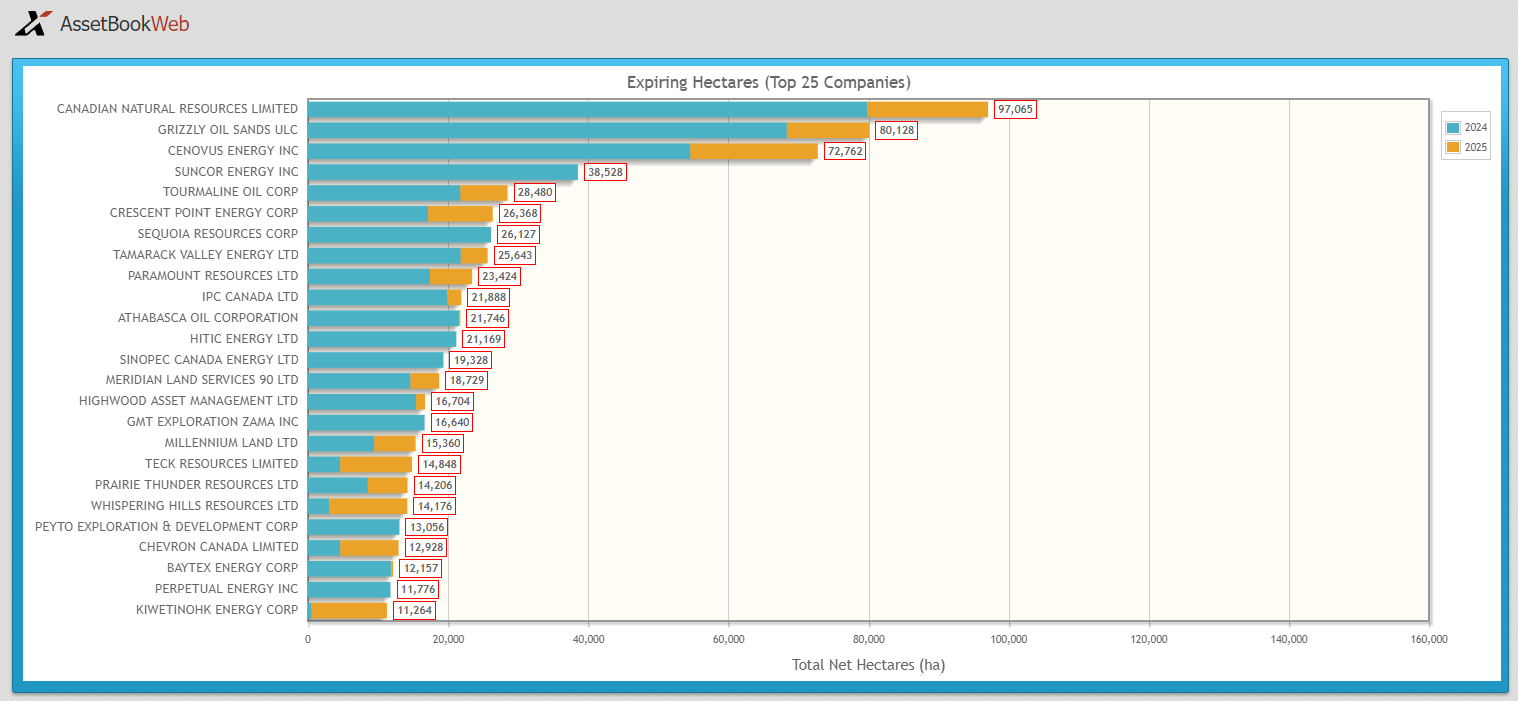
25 of 242 companies represent 62% of land expiring in the next 12 months.
When looking at the top 25 companies (Fig. 1), it is also useful to look at the land numbers in context to the overall total of expiring land. These 25 companies represent 62% of the total 674,501 hectares (ha) expiring in Alberta in the next 12 months. An additional 217 companies represent the remaining 38% of expiring land.
Looking at the same land search after removing the expiry criteria, and grouping by company, we can calculate that the top 25 companies by total hectares in Alberta represent 50% of the total crown land in Alberta. They represent 8% of all companies with crown land but hold 50% of the total 29.9million crown hectares in the province. The total of 674,501 ha expiring represents 2.3% of Alberta’s total 29.9 million crown hectares.
2.3% of the total land in Alberta is expiring in the next 12 months.
Comparing expiring land to total land by company for the top 25 companies listed above, we can see how the expiring land compares to their total land base. The percentage of total expiring ranges from 2% to 64% with an average of 14%
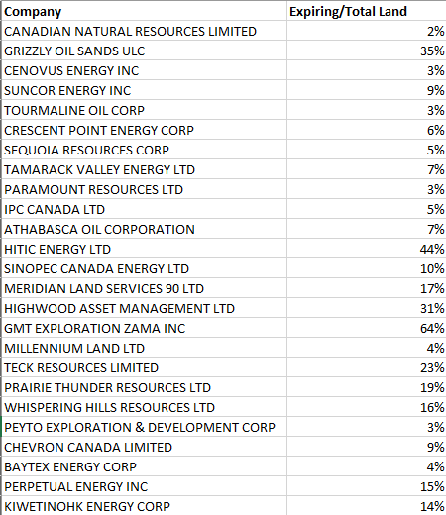
Collectively, the top 25 companies with expiring land represents an average of 14% of total land holdings.
The total percentage of the company’s land expiring might be a factor when looking at potential opportunities. This percentage, however, is only one piece of the puzzle when looking at opportunities.
In addition to knowing the top 25 companies with lands nearing expiry, it may be useful to know the bonus amounts that were paid on those lands. AssetBook allows you to easily identify and rank expiring lands based on the size of bonuses paid. This will help you prioritize companies that have the most money on the line and therefore may be more open to farm-in or partnership opportunities.
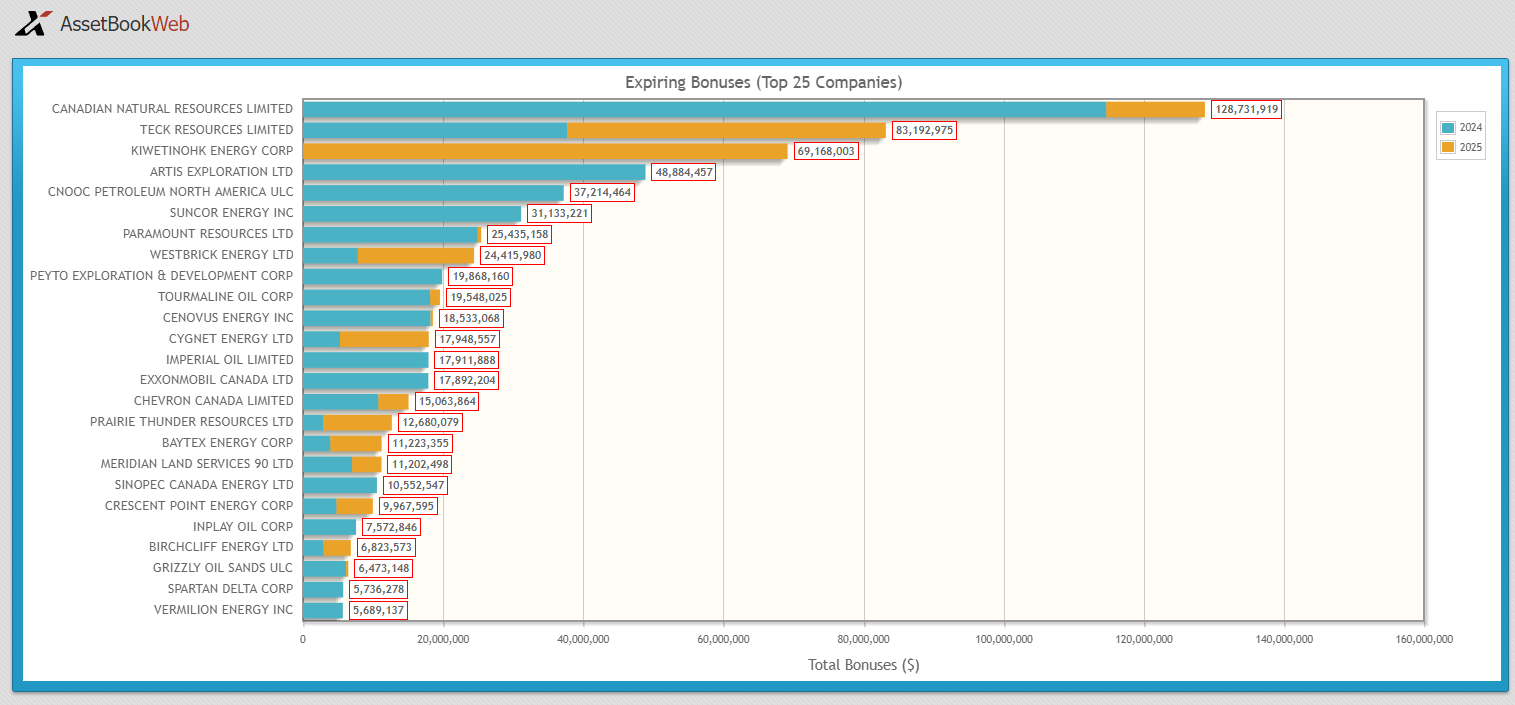
As with the total land, the top 25 companies, or 8% of the total companies, represent 75% of the total expiring bonuses.
By comparing the two charts, and corresponding values, you can calculate the average $/ha for these top 25 companies. They may have significant value expiring, but how does the total compare to the total ha expiring? How valuable is the land expiring relative to the total pool of expiring land?
By plotting $/ha from highest to lowest, you can see the value of the land expiring by company. This gives you an understanding of how valuable the land might be to each company, which may correlate to motivation to explore opportunities.
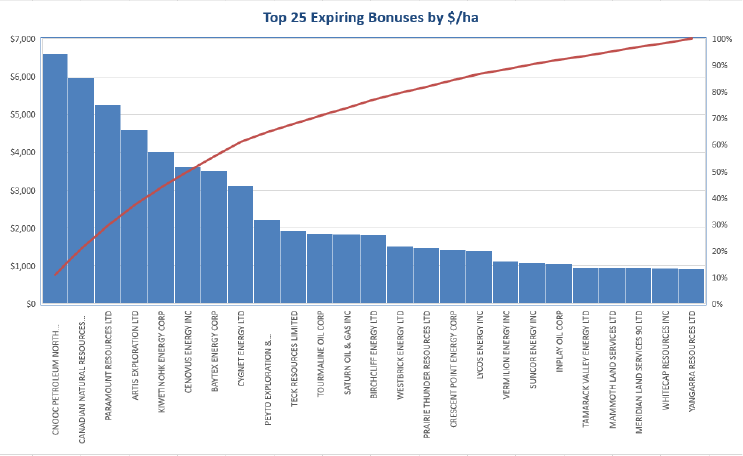
The value per ha of land expiring in the next 12 months ranges from +$15,000 to <$100.
There is a significant range of value per hectare on the lands expiring in the next 12 months.
When looking at potential opportunities, the total numbers are only a starting point. Looking at the totals in context of both overall company totals as well as the unique value of the land itself can give you a better picture of how valuable the land may be to each unique company.
Is there more you would like to see in the expiring land report? Contact us here.
AssetBook allows you to search for expiring lands by province, by company, or by any geographic area. The results can be viewed in tabular format or displayed on a map to help with visualization. To learn more about how the data in AssetBook can help you, contact XI Technologies.
Upcoming Webinar: Join us for a special presentation on ARO for Financial Tracking & Reporting.
When: April 25th 10:00am (MST) – Register Now!
Upcoming Certification Course:
ARO Manager For Financial Tracking and Reporting Certification Course provides practical, hands-on professional development for anyone interested in expanding their knowledge of Asset Retirement Obligation (ARO) tracking and reporting.
When: April 30 and May 2 at 9:00am
Space is limited so be sure to register now for the course. This is a 2 x half-day course taking place in person at the XI office on morning of April 30th and the morning of May 2nd. Register here.
Each week, XI Technologies uncovers trends and insights using our enhanced data and software focused on the WCSB. If you’d like Word to the Wise delivered directly to your inbox, subscribe here. For more tips and to learn about how XI’s AssetSuite can help with your high-level analysis visit XI’s website or contact XI for a demo.
In the dynamic world of energy investment, information is not just power—it’s profit. Every investor decision, whether in oil, gas, or related sector, hinges on having access to accurate and timely data. This is especially true for those eyeing Alberta’s energy landscape, a key player in North America’s energy sector. Recently, Alberta’s Energy Regulator (AER) made a groundbreaking step by releasing Natural Gas Liquids (NGL) data, a move poised to revolutionize investment strategies and reshape the industry’s landscape.
What Are NGLs?
Natural Gas Liquids are hydrocarbons extracted alongside natural gas production, including ethane, propane, butane, isobutane, and pentanes. NGLs are valuable commodities in various industrial processes and as feedstocks for petrochemical production. In today’s market, they can command similar pricing to oil, having a profound impact on the economics of the play.
The Impact of the AER’s Data Release
The AER’s release of NGL data marks a pivotal moment for investors. Historically, data on NGL production, infrastructure, and market dynamics were fragmented and often difficult to access. This lack
of transparency posed challenges for investors seeking to understand the full picture of Alberta’s energy sector. However, with the AER’s decision to make NGL data publicly available, a wealth of information has been unlocked, providing investors with unprecedented insights into this vital aspect of the energy market.
Impact on Investment Decisions
The availability of comprehensive NGL data has far-reaching implications for investment decisions in Alberta’s energy sector:
- Improved Market Analysis/Enhanced Asset Valuation: By understanding production trends, export capacity, and market trends, investors can identify lucrative opportunities and mitigate risks more effectively. Accurate NGL production data allows for more precise valuation models, resulting in better-informed investment decisions and improved portfolio performance.
- Optimization and Innovation: Transparency in NGL data fosters innovation within the energy sector. By understanding production levels and infrastructure capacities, investors can identify opportunities to streamline logistics, reduce costs, and maximize operational efficiency. Armed with comprehensive information, entrepreneurs and researchers can identify gaps in the market and develop innovative solutions to address them, driving technological advancement and economic growth.
- Facilitated Regulatory Compliance: Access to reliable NGL data aids investors in navigating regulatory requirements more effectively. By staying informed about production volumes and environmental impacts, investors can ensure compliance with regulations and minimize legal risks associated with their investments.
Looking Ahead
As you are likely already aware, BCOGC has been providing NGL data for some time now. We are pleased to announce that Alberta’s AER has followed suit by providing a breakdown of production. By increasing transparency and accessibility, this decision empowers investors to make smarter, more informed decisions, driving growth and innovation within Alberta’s energy sector. As stakeholders continue to leverage this wealth of information, we can expect to see increased efficiency, improved risk management, and sustained investment in the region’s energy infrastructure. Alberta’s journey towards a more transparent and data-driven energy landscape is well underway, and the implications for investors are profound.
XI has integrated these breakdowns into AssetBook, offering detailed summaries organized by company or region, enriched with our working interest data.
We believe that this update will significantly enrich the capabilities of AssetBook and empower our clients to make smarter investment decisions in an ever-evolving market landscape.
- Enhanced Market Insights: More thorough analysis of market trends in the Alberta region.
- Improved Risk Management: Elevate assessments and mitigate risks with investments and portfolio management.
- Expanded Coverage: Our commitment to expanding data coverage ensures that AssetBook users have access to a diverse range of datasets, enabling more comprehensive analyses and informed decision-making across various asset classes.
The addition of NGL data from Alberta into AssetBook has been designed to ensure a seamless user experience, allowing for easy access and integration into existing workflows.
—
Note: We have been informed that our previous post had some issues with the links. As with all of XI’s articles, our previous post, Abandonment & Reclamation Across WCSB in 2023, is available on our website. Review the article and interactive dashboards here.
Upcoming Webinar:
Join us for a special presentation on ARO for Financial Tracking & Reporting.
When:
April 25th 10:00am (MST) – Register Now!
Upcoming Certification Course:
ARO Manager For Financial Tracking and Reporting Certification Course provides practical, hands-on professional development for anyone interested in expanding their knowledge of Asset Retirement Obligation (ARO) tracking and reporting.
When:
Space is limited so be sure to register now for the course. The two-half day course takes place on morning of April 30th and the morning of May 2nd.
Each week, XI Technologies uncovers trends and insights using our enhanced data and software focused on the WCSB. If you’d like Word to the Wise delivered directly to your inbox, subscribe here. For more tips and to learn about how XI’s AssetSuite can help with your high-level analysis visit XI’s website or contact XI for a demo.
Each week, XI Technologies uncovers trends and insights using our enhanced data and software focused on the WCSB. If you’d like Word to the Wise delivered directly to your inbox, subscribe here.
In the world of acquisitions and divestitures (A&D), navigating through a sea of opportunities requires a strategic approach to ensure that the chosen path aligns with corporate visions and objectives. Each company or individual might have their unique workflow, but incorporating certain key strategies can significantly enhance the efficiency and effectiveness of the process. Here are five tips offered by XI to maximize your time and effort while exploring A&D opportunities.
1. High-level scoping criteria:
Initiating the A&D journey demands a high-level overview to filter out opportunities that don’t align with your corporate vision. Criteria like production qualities, undeveloped land, non-core assets, and financial distress indicators from evaluations of financials or liability values are pivotal in this phase. This initial screening sets the stage for a focused exploration. Clearly outlining the criteria by which you would like to search for your target assets is critical to finding the right opportunity.

Figure 1: Example of some high-level scoping criteria. Source: AssetBook.
2. Production Profile and Land Analysis
Following the high-level investigation, delving deeper into the opportunity’s production profile and available land helps narrow down potential choices. Details regarding production statistics, well declines/reserves, operational nuances (such as operatorship, working interest percents, types of production, etc.), land expiry schedules, recent land sale prices, and other upside potential analysis play a crucial role in this stage. It is also important to look at area trends , such as land sale postings, and large shifts in ownership and drilling activity, to see if you’re going into a highly competitive area or one with a drastically changing landscape.
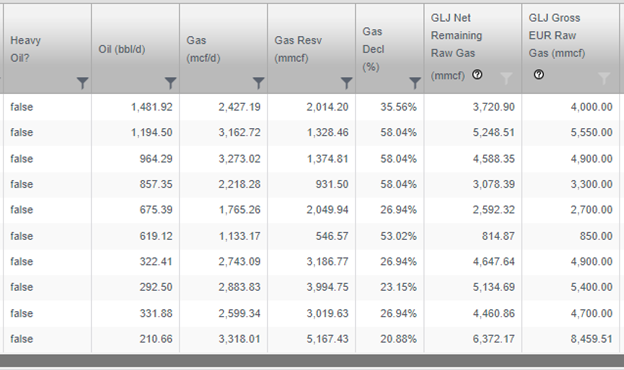
Figure 2: Example of an opportunitys production profile. Source: AssetBook.

Figure 3: Total bonuses paid by field. Source: AssetBook Graphs Module.
- Evaluating Liabilities
Transitioning into a more serious evaluation phase involves assessing liabilities like LLR (Licensee Liability Rating), LCM (Licensee Life-Cycle Management), and ARO (Asset Retirement Obligation). Calculating post-transaction LLR for both the buyer and seller provides a clearer picture of your regulatory requirements and uncovers possible impacts with governmental bodies. Being able to estimate the impact of the deal such as changes to your position within your peer group or determining a possible inactive well ratio allows you to filter out those opportunities which may not be worth investing more time into persuing. Analyzing non-operator liabilities, variances using different rates, and scenario-based cost models for ARO further enhances decision-making and reduces the risk going into the deal.

Figure 4: Example of potential deal in terms of liabilities and risk analysis. Source: AssetBook LCA Module.
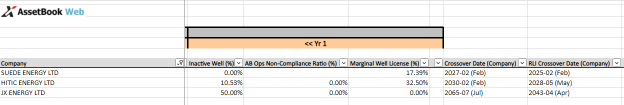
Figure 5: Overview of companies liability impacts. Source: AssetBook LCA module.
4. Emissions Analysis
Considering the increasing focus on environmental sustainability, evaluating volumes and greenhouse gas emissions becomes imperative. Factors such as fuel flare vent, intensity effects, gas conversion rates, and regulatory commitments need detailed scrutiny to align with environmental objectives. A post transaction Emissions summary can easily be created for both the buyer and the seller.
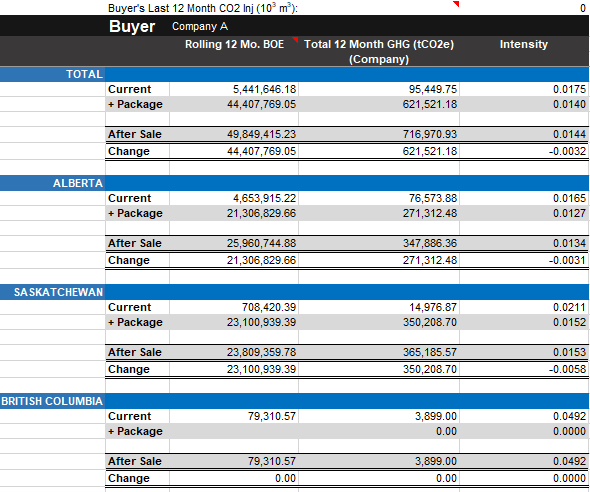
Figure 6: Post-transaction emissions summary. Source: AssetBook Emmissions Module.
5. Production Chain Evaluation
Lastly, scrutinizing the entire production chain completes the comprehensive assessment process. This involves mapping out the complete chain of production to market, analyzing efficiencies, identifying potential bottlenecks, and exploring opportunities for optimization. Being able to visually “follow the molecules” provides a deeper understanding of the business case for each opportunity.
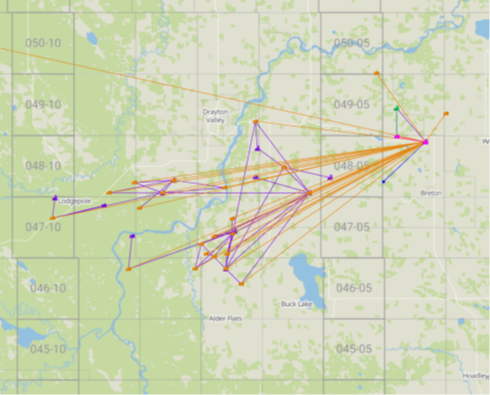
Figure 7: “Follow the molecule” wells to facility map. Source: AssetBook Production Chain Module.
In conclusion, a methodical approach to A&D opportunities that integrates these five strategies will quickly streamline the evaluation process. While every workflow may have its unique nuances, incorporating these first five steps offers a robust framework for maximizing the efficiency and effectiveness of the assessment phase in M&A endeavors.
For more tips and to learn about how XI’s AssetSuite software can help with your high-level analysis of potential mergers, acquisitions, and opportunities, including examining potential liabilities and emissions, click here.
Visit XI’s website and contact XI for a demo.
Each week, XI Technologies uncovers trends and insights using our enhanced data and software focused on the WCSB. If you’d like Word to the Wise delivered directly to your inbox, subscribe here.
On May 30, 2023, XI Technologies took a deeper dive into the region of Grande Prairie with respect to expiring lands, assets and drilling activity. We asked at that time what other regions would be of interest, and various areas in Saskatchewan were requested.
Let’s take a deeper look at the region of Saskatchewan Area II (Sask Area II) and its oil and gas ownership.
The smallest landmass of all Saskatchewan regions, this little powerhouse had 42.6%, or 702 out of 1648 of the wells drilled in Saskatchewan in the last 12 months.
There are currently 109,361 boe/day coming from the region defined as Sask Area II or 21% of all production in Saskatchewan (Figure 1). The Viking zone currently makes up just shy of 60% of the production from this area:
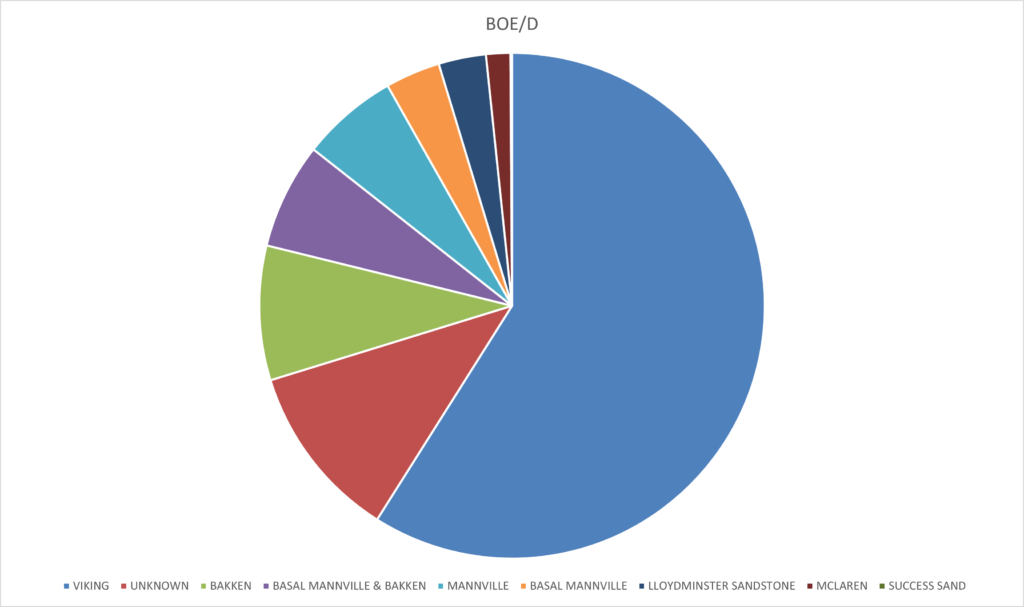
There is a large tranche of “Unknown” zone production the bulk of which is brand new and most likely will prove out to be Viking or Success Sand, almost all of which is horizontal drilling.
While the Viking play in this area is not new, the vertical well drilling into the Viking started around 2020 and really gained momentum in 2017 with 1025 wells having a final drill date in that year. The biggest owner of this play is Teine Energy Ltd., as the graph below illustrates:

These Viking wells and facilities have a total undiscounted liability of approximately $1.322 Billion, with 31% of the well licenses and 65% of the facilities designated as inactive. Over 66% of the active wells are 10 years or younger, and 728 spills have been reported on all assets.
To see a full summary of Sask Area II ownership, please download our Sask Area II report here.
If you’d like to learn more about how XI’s AssetSuite software can analyze companies, packages, or regions throughout Western Canada, visit our website or contact XI Technologies.
Each week, XI Technologies uncovers trends and insights using our enhanced data and software focused on the WCSB. If you’d like Word to the Wise delivered directly to your inbox, subscribe here.
When talking about the energy industry in Canada, you often hear the word consolidation. We looked at what some of the top legal and financial institutions in Canada have said about the consolidation environment in the Western Canadian Sedimentary Basin (WCSB)
In early 2021, the legal firm Torys LLP noted the challenges faced by the industry through the COVID19 Pandemic in their article What’s next for Canadian oil and gas in 2021. Looking ahead, Torys noted a flurry of consolidation and predicted:
“Consolidation activity will continue as companies seek scale and rebalance asset portfolios.”
Further, Osler, Hoskin & Harcourt LLP, states on their Energy – Mergers and Acquisitions page:
“Canada’s energy industry has undergone consolidation over the last several years and it’s unlikely that trend will change anytime soon.”
In a recent article published in Canadian Lawyer, Mergers and acquisitions in the Canadian oil and gas sector set to increase, Deloitte report says.
Deloitte also notes that M&A in the sector was at its lowest since 2008, but looking ahead:
“Mergers and acquisitions in the Canadian energy sector should be robust in 2023 thanks to more stable oil prices, well-performing companies and the pressure to deploy capital.”
According to the Oxford Dictionary, the definition of consolidation is as follows:
- the action or process of making something stronger or more solid;
- the action or process of combining a number of things into a single more effective or coherent whole.
How much consolidation occurred from December 2020 to December 2022? Is it truly consolidation, or just moving around ownership of the molecules?
At the end of 2020, there were 5,782 licensed companies in the WCSB. At the end of 2022, there were 5,800. The split between producing and non-producing companies remained constant at 20% and 80%, respectively.

This means that 80% of the licensed companies have either land or assets with liability but no production. In the case of midstream entities, revenue from active facilities offsets this liability. For entities with land holdings only, there is value in the undeveloped land, which is area and zone specific. For others, there may be only liability associated with the licensed entity.
If we isolate producing companies simultaneously, the total dropped from 1,166 to 1,141, or by 25 companies. The total number of companies between December 2020 – December 2022 grew by 18, or less than 1%. Conversely, the number of producing companies between December 2020 – December 2022 decreased by 2%.
Looking at producing companies and distinguishing between private and public companies, of the 25 fewer producing companies, 18 were private, and 7 were public companies.

The total number of private companies dropped by 2%, while the number of public companies dropped by 6%.
On a production basis, the total production from the end of 2020 to the end of 2022 increased from 5.7 mmBoe/d to 6.4 mmBoe/d, an increase of 13%. At the end of 2020, 2021, and 2022, production from private companies represented 76%, 78%, and 77%, respectively, of the total production.

Production from private companies increased by 14%, while production from public companies increased by 7%.
As seen in the above charts, there have been negligible changes in the total number of companies, or in the shift of production between private and public companies in the producing space. But is it consolidation? Are these changes making the WCSB stronger as a whole?
When the number of producing companies in the WCSB dropped while the overall total number of companies increased, then the number of non-producing companies increased. From December 2020 to December 2022, non-producing companies increased from 4,616 to 4,659, or by 43 companies. Non-producing companies increased by 1%.
While that may seem like a small change, growth in liability, without offsetting revenue streams, can be a concern. Over this time frame, non-producing wells in the WCSB consistently represented 5% of the total gross wells. However, the total gross wells in this subset increased from 45,117 to 47,447. This data does not show which companies may have land or licensed facilities to offset the liability, but the trend is certainly something to note.

The total gross wells held by non-producing companies increased by 5% from December 2020 – December 2022.
Individual companies may get stronger through mergers and acquisitions. But for these changes to be considered true consolidation for the entire WCSB, the entire space must get stronger, more effective, or more coherent. Growing liability in the non-producing space is something to monitor and assess as we examine the impact of mergers and acquisitions to ensure liability can be balanced by revenue.
View a list of Total Non-Producing Companies by clicking here.
To read our last year’s edition on Consolidation in the WCSB, click here.
To learn more about how XI’s AssetSuite software can analyze companies, packages, or regions throughout Western Canada, visit XI Technologies or contact us.
Alberta Gas Processing – A Summary
Each week, XI Technologies uncovers trends and insights using our enhanced data and software focused on the WCSB. If you’d like Word to the Wise delivered directly to your inbox, subscribe here.
Who Controls Gas Processing Capacity in Alberta?
How well do you know gas processing infrastructure in Alberta? Take our brief quiz, and read below to find out more.
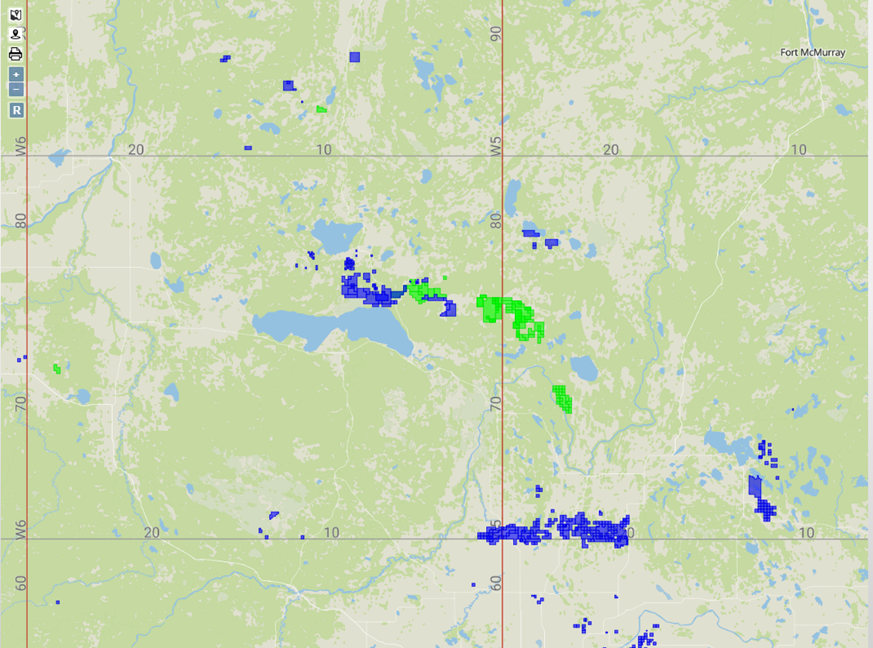
In the province of Alberta, there are approximately 500 active gas processing plants, 12 fractionation plants, and 6 straddle plants. The density of these facilities is shown on the map below (left) as provided by the Alberta Energy Regulator. The map on the right shows the plant locations.

Figure 1 – Gas Plant Density in Alberta

Figure 2: Gas Plant Locations in Alberta
The total gas production in Western Canada is just under 21 Billion cubic feet per day (Bcf/d), with approximately 7.4 Bcf/d coming from British Columbia and 13 Bcf/d from Alberta.
What does that production look like from Alberta’s midstream plant processing perspective? If we look at the sales gas capacity of all gas plants in Alberta, excluding straddle plants, the total capacity is 25.5 Bcf/d.
Alberta has almost double the gas processing capacity we currently need.
How does that capacity break down from a regional perspective?
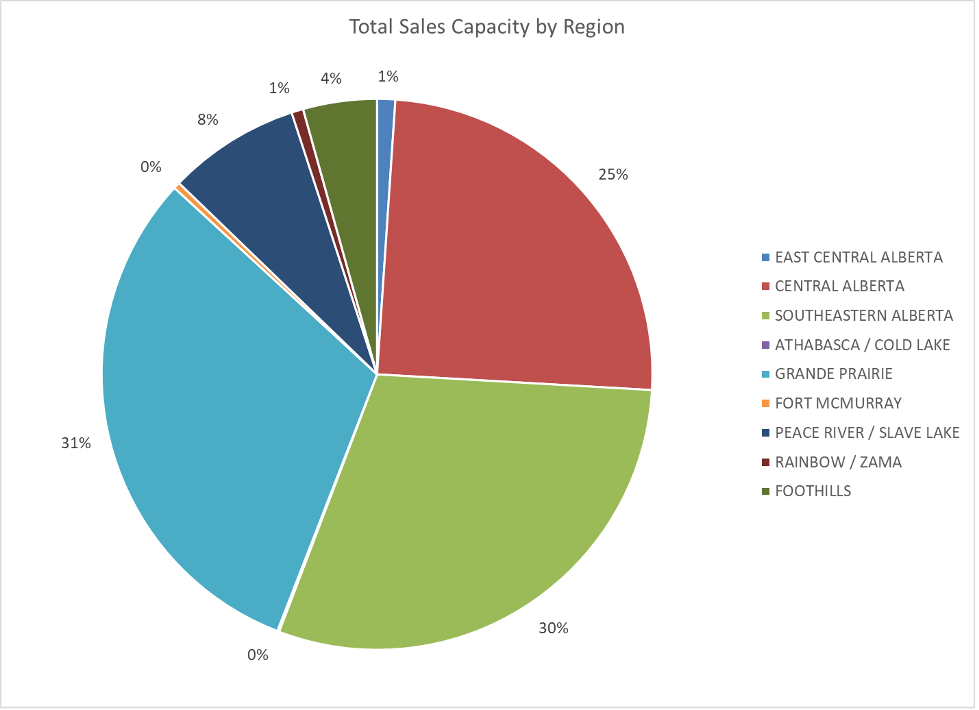
Figure 3 – Total Sales Capacity by Region
Central Alberta, Southeastern Alberta, and Grande Prairie account for 85% of the available processing capacity in Alberta. Receipts from these same plants are just over 13 Bcf/d. Breaking this down by region shows the following:
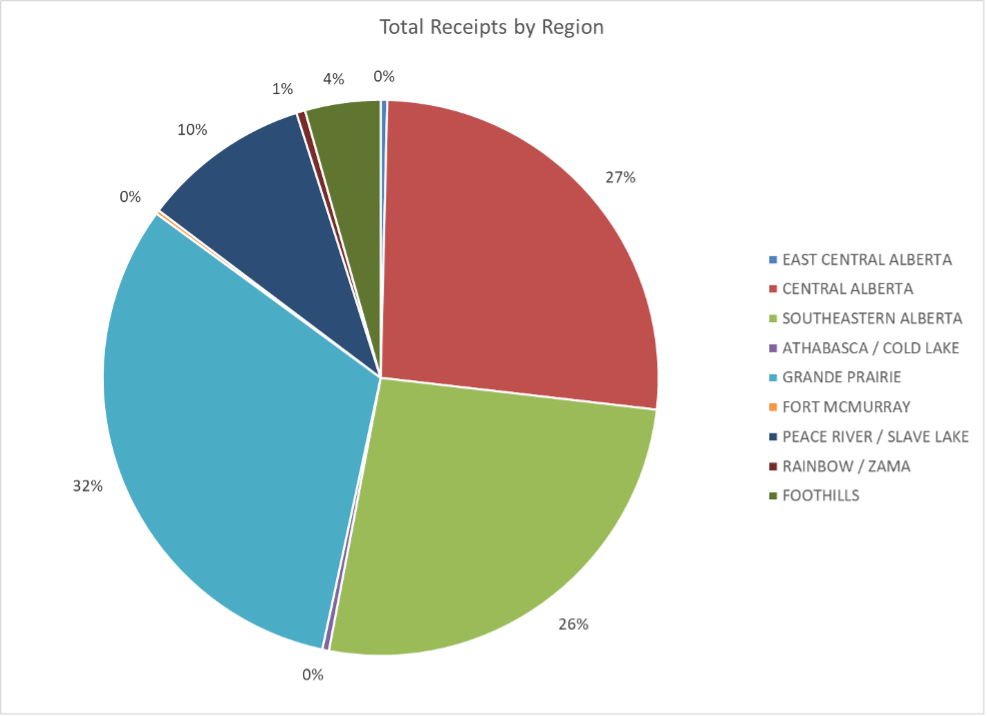
Figure 4 – Total Receipts by Region
Central Alberta, Southeastern Alberta, and Grande Prairie also account for the majority of receipts, with 85% of the receipts in Alberta. The breakdown is consistent with the sales capacity breakdown, showing consistent regional utilization percentages across the province.
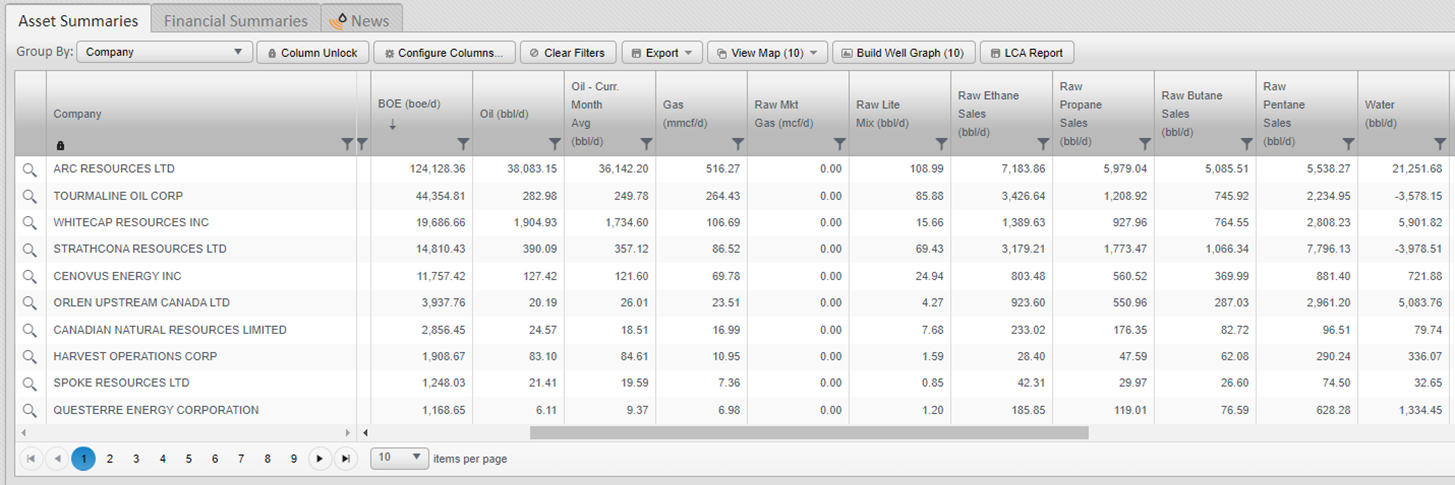
If we break down receipts by operator and working interest share, the top 25 operators in Alberta are:
| Company | WI Receipts | % of Total | Cumulative |
| PEMBINA PIPELINE CORPORATION Total | 1,863,888 | 15% | 15% |
| CANADIAN NATURAL RESOURCES LIMITED Total | 1,078,573 | 9% | 24% |
| TOURMALINE OIL CORP Total | 971,180 | 8% | 32% |
| KEYERA CORP Total | 851,395 | 7% | 39% |
| PEYTO EXPLORATION & DEVELOPMENT CORP Total | 539,892 | 4% | 43% |
| ENERGY TRANSFER CANADA ULC Total | 484,865 | 4% | 47% |
| CENOVUS ENERGY INC Total | 441,493 | 4% | 51% |
| ALTAGAS LTD Total | 394,459 | 3% | 54% |
| ARC RESOURCES LTD Total | 385,133 | 3% | 57% |
| TIDEWATER MIDSTREAM AND INFRASTRUCTURE LTD Total | 334,766 | 3% | 60% |
| OVINTIV CANADA ULC Total | 332,439 | 3% | 63% |
| ADVANTAGE ENERGY LTD Total | 297,414 | 2% | 65% |
| BIRCHCLIFF ENERGY LTD Total | 265,094 | 2% | 67% |
| PARAMOUNT RESOURCES LTD Total | 230,736 | 2% | 69% |
| CSV MIDSTREAM SOLUTIONS CORP Total | 224,470 | 2% | 71% |
| SHELL CANADA LIMITED Total | 217,637 | 2% | 73% |
| TORXEN ENERGY LTD Total | 186,135 | 2% | 74% |
| CONOCOPHILLIPS CANADA RESOURCES CORP Total | 170,873 | 1% | 76% |
| REPSOL OIL & GAS CANADA INC Total | 166,537 | 1% | 77% |
| TAQA NORTH LTD Total | 157,257 | 1% | 78% |
| WHITECAP RESOURCES INC Total | 151,324 | 1% | 80% |
| CANLIN ENERGY CORPORATION Total | 144,056 | 1% | 81% |
| NORTHRIVER MIDSTREAM ENERGY LIMITED Total | 136,545 | 1% | 82% |
| NUVISTA ENERGY LTD Total | 116,630 | 1% | 83% |
| OBSIDIAN ENERGY LTD Total | 114,614 | 1% | 84% |
Figure 5: Top 25 Working Interest Receipts showing Midstream (underlined) and Producers
The top 25 Operators account for 85% of receipt production in Alberta. Within the top 25 corporations, midstream companies represent 42% of the total, with producing companies holding the remaining 58%.
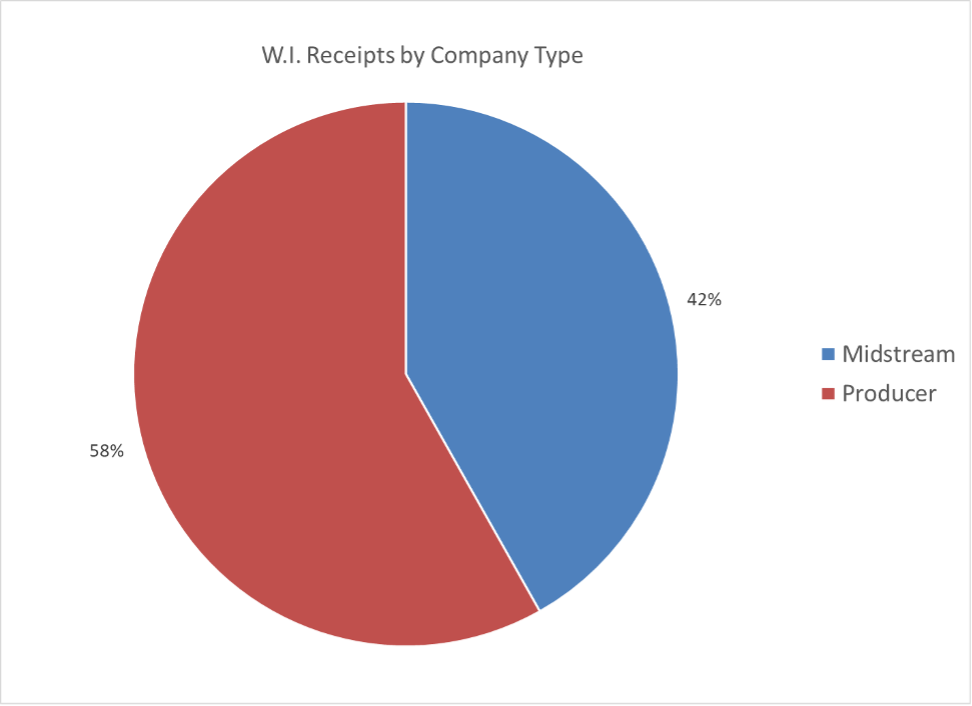
Figure 6: Working Interest Receipt Percentage by Company Type
Of course, processing capacity is one piece of bringing new gas onstream. When considering new development, you also must consider:
- Pipeline ownership
- Pipeline infrastructure
- Pipeline capacity
Stay tuned for future posts where we continue to explore midstream infrastructure in Alberta.
If you’d like to learn more about how XI’s AssetSuite software can analyze companies, packages, or regions throughout Western Canada, visit our website or contact XI Technologies.
Subscribe to XI Technologies’ Word to the Wise newsletter for valuable insights and trends derived from their unique combination of enhanced industry data. Get the latest updates delivered directly to your inbox. Subscribe here.
Previously, we explored the Dodsland field in Saskatchewan, which has become a predominately horizontal oil play in the Viking sand. Check out this article where we examined various aspects of Dodsland such as ownership, production history, and emissions. Building on that, we have now utilized drilling data from XI Technologies to gain a comprehensive understanding of drilling trends across the entire play.
Having knowledge of the key drilling players in the area is crucial. The graph presented below provides a clear representation of their respective activity over the last five years.
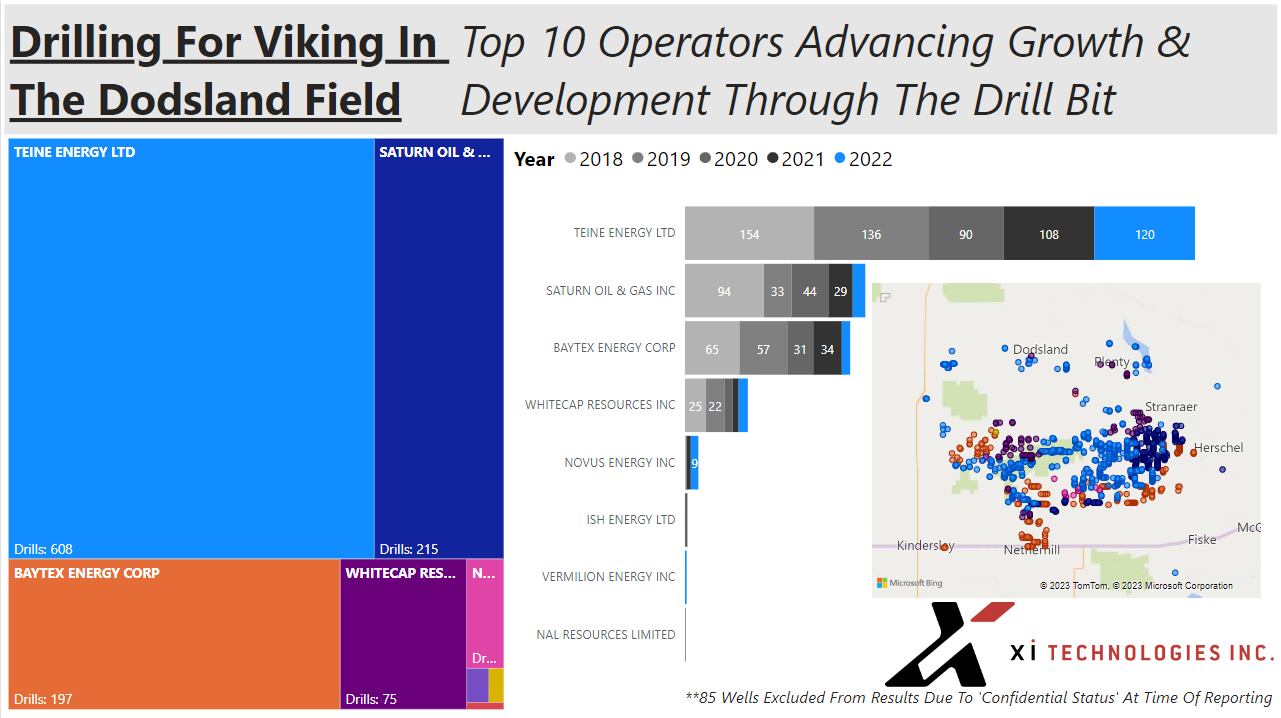 Figure 1 – Top 10 Operators Advancing G&D Through the Drill Bit
Based on this analysis, Teine Energy Ltd (“Teine”) emerges as the largest player in the region, followed by Saturn Oil & Gas Inc. (“Saturn”), with Baytex Energy Corp (“Baytex”) and Whitecap Resources Inc. (“Whitecap”) occupying the third and fourth positions, respectively.
Looking at the graphic below we get a better understanding of all the players that have been involved in drilling operations over the past decade – Baytex, Whitecap, Teine and Saturn have been the most consistent players in the area while there have been many that shifted their focus away from Dodsland over time. This was Saturn’s top field until the purchase of Ridgeback Resources Inc. Which was discussed in our blog from Feb 28, 2023, located here.
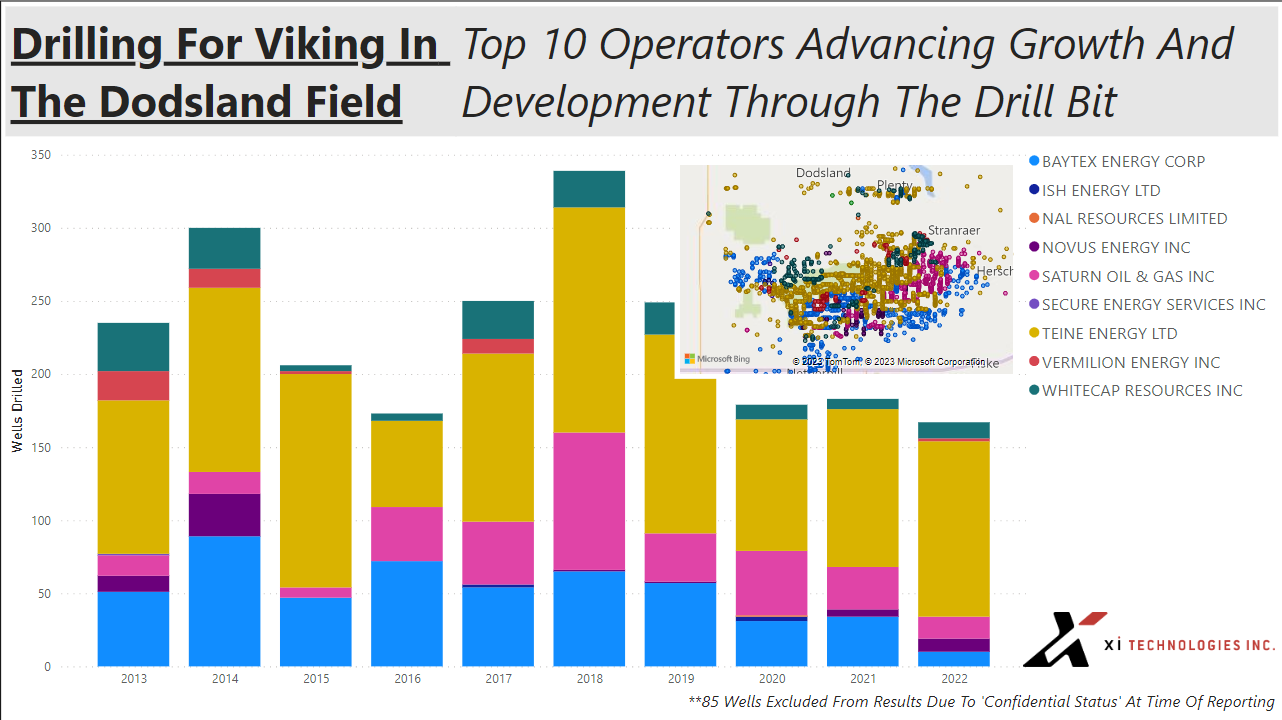 Figure 2 – Top 10 Operators Advancing G&D Through the Drill Bit Over 10 Years
Let’s compare that to production during this period. The first image is a comparison of Initial Production to Rig Release date showing the increase in initial production from these more complicated drills:
 Figure 3 – Initial Production vs Rig Release Date
If we look at production by year, we can see that 2014, 1017 and 2018 appear to have been very successful with all recent years being relatively consistent:
 Figure 4 – Working Interest by Year
Canada’s oil and gas sector is making the global stage with top-notch innovation in well construction. Check out the graph below, where you can see companies reaching new heights (and depths) with each passing year, as they drill increasingly complex and lengthy wells as the play becomes predominately horizontal wells.
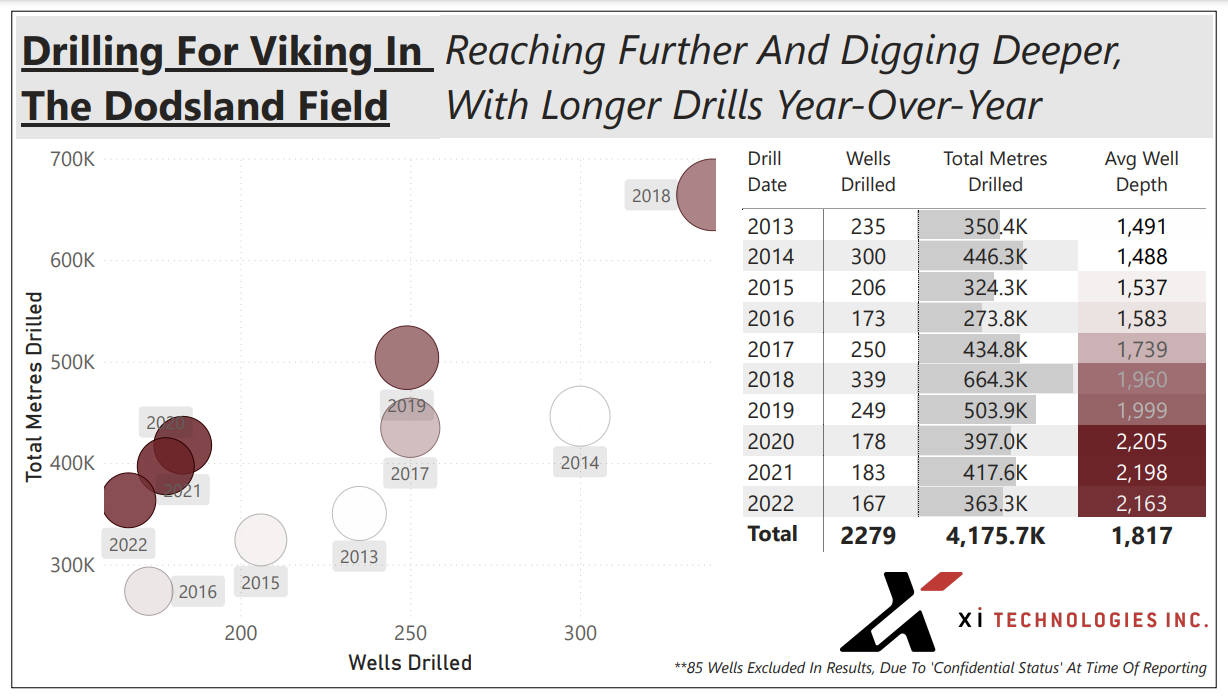 Figure 5– Depth of Wells in The Area
So, we just explored the trending ‘reach’ as drills continue to lengthen, but of course not all wells are created equal.
As shown in Figure 6, Dodsland has seen a broad spectrum of drilling techniques, with the majority leaning toward shorter wells (350-750m). Should this area continue to remain a hotspot however, we can surely expect the scale to tilt in favor of these deeper depth groups.
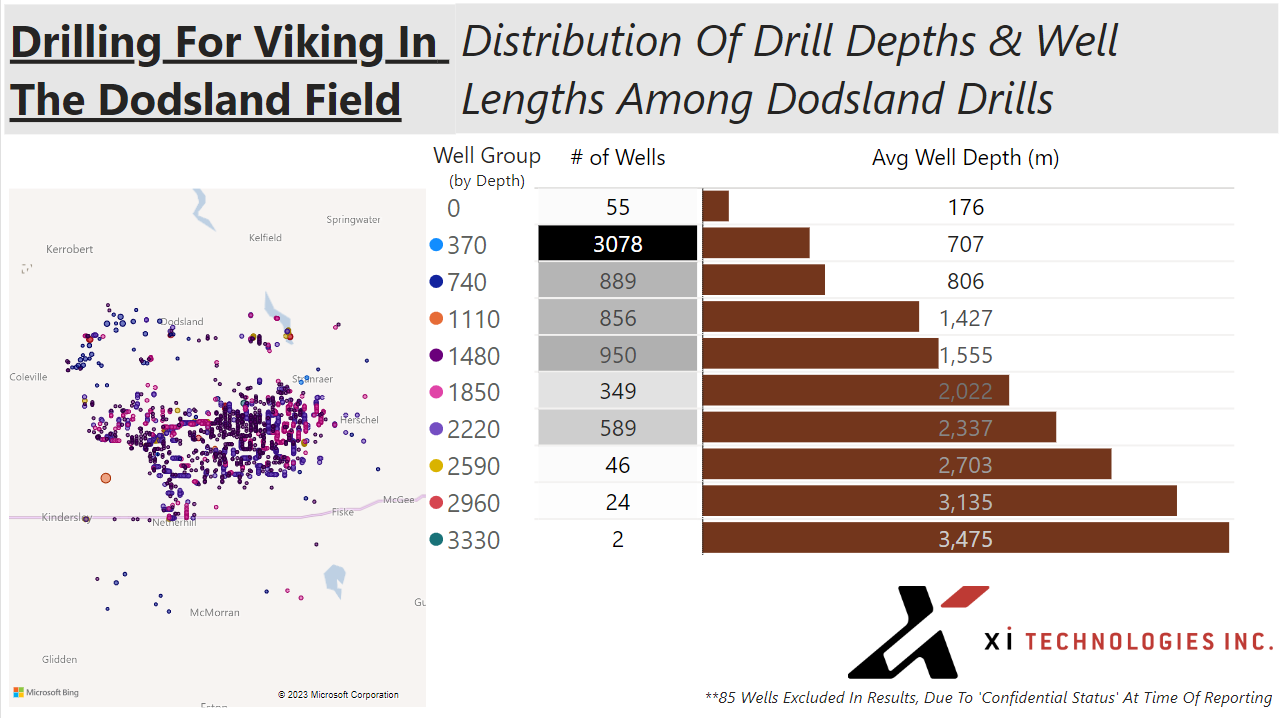 Figure 6 – Distribution of Drill Depths & Well Lengths
You can also access the free and interactive dashboard with the above data on Dodsland.
To learn more about how XI’s OffsetAnalyst software can help you improve drilling research and performance, contact XI Technologies.
Each week, XI Technologies scans its unique combination of enhanced industry data to provide trends and insights that have value for professionals doing business in the WCSB. If you’d like to receive our Word to the Wise in your inbox, subscribe here.
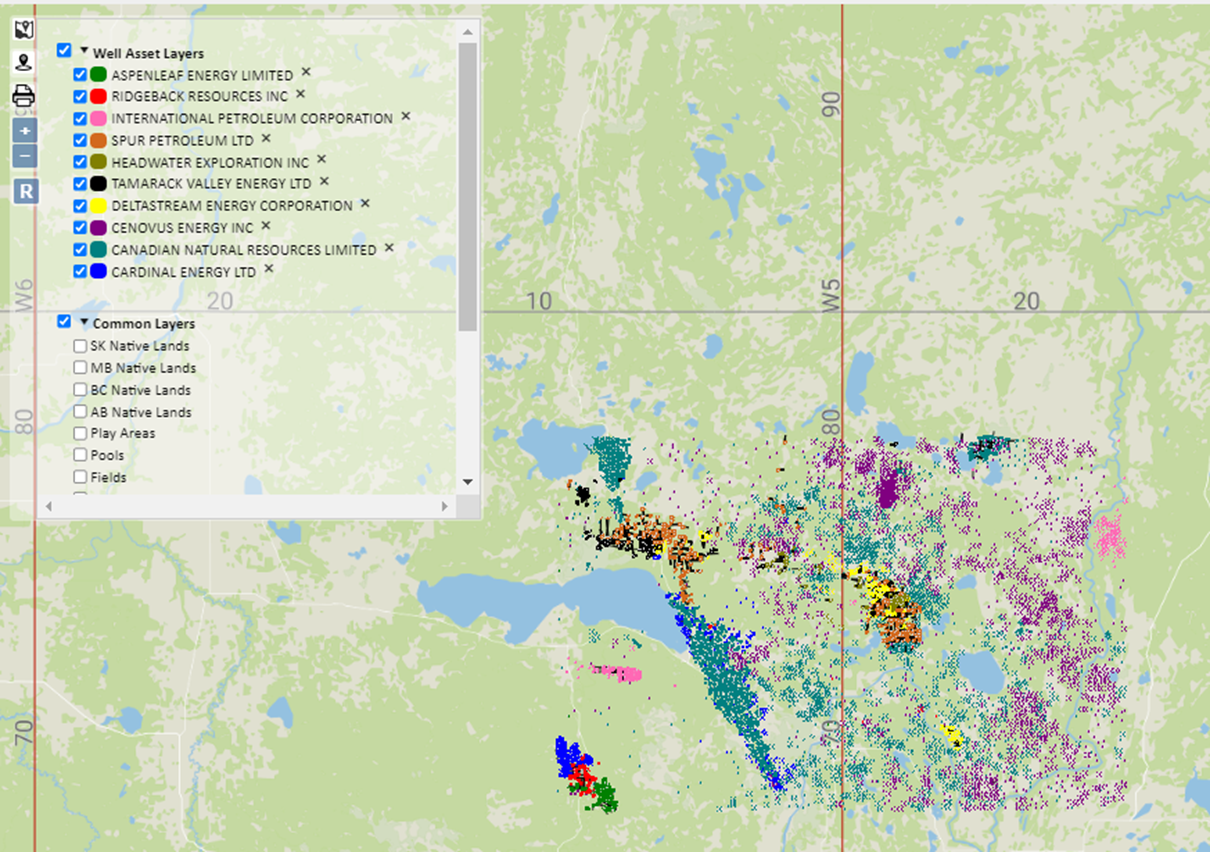
The Clearwater oil reserve in Alberta receives attention once again with the latest acquisition from Tamarack Valley Energy Ltd. (Tamarack) of Deltastream Energy Corp (Deltastream), whose assets are clustered in a Clearwater fairway. Tamarack announced its biggest takeover: $1.4B for private producer Deltastream, to further expand their growing Clearwater heavy oil play in north-central Alberta.
What do the companies look like prior to completing the agreement? What do we know about each company’s assets, core areas, and recent activity? How might this combination affect others in the area? We’ve looked at both companies through a few different lenses using our AssetSuite software tools to allow you to compare the companies and gain some insight of your own.
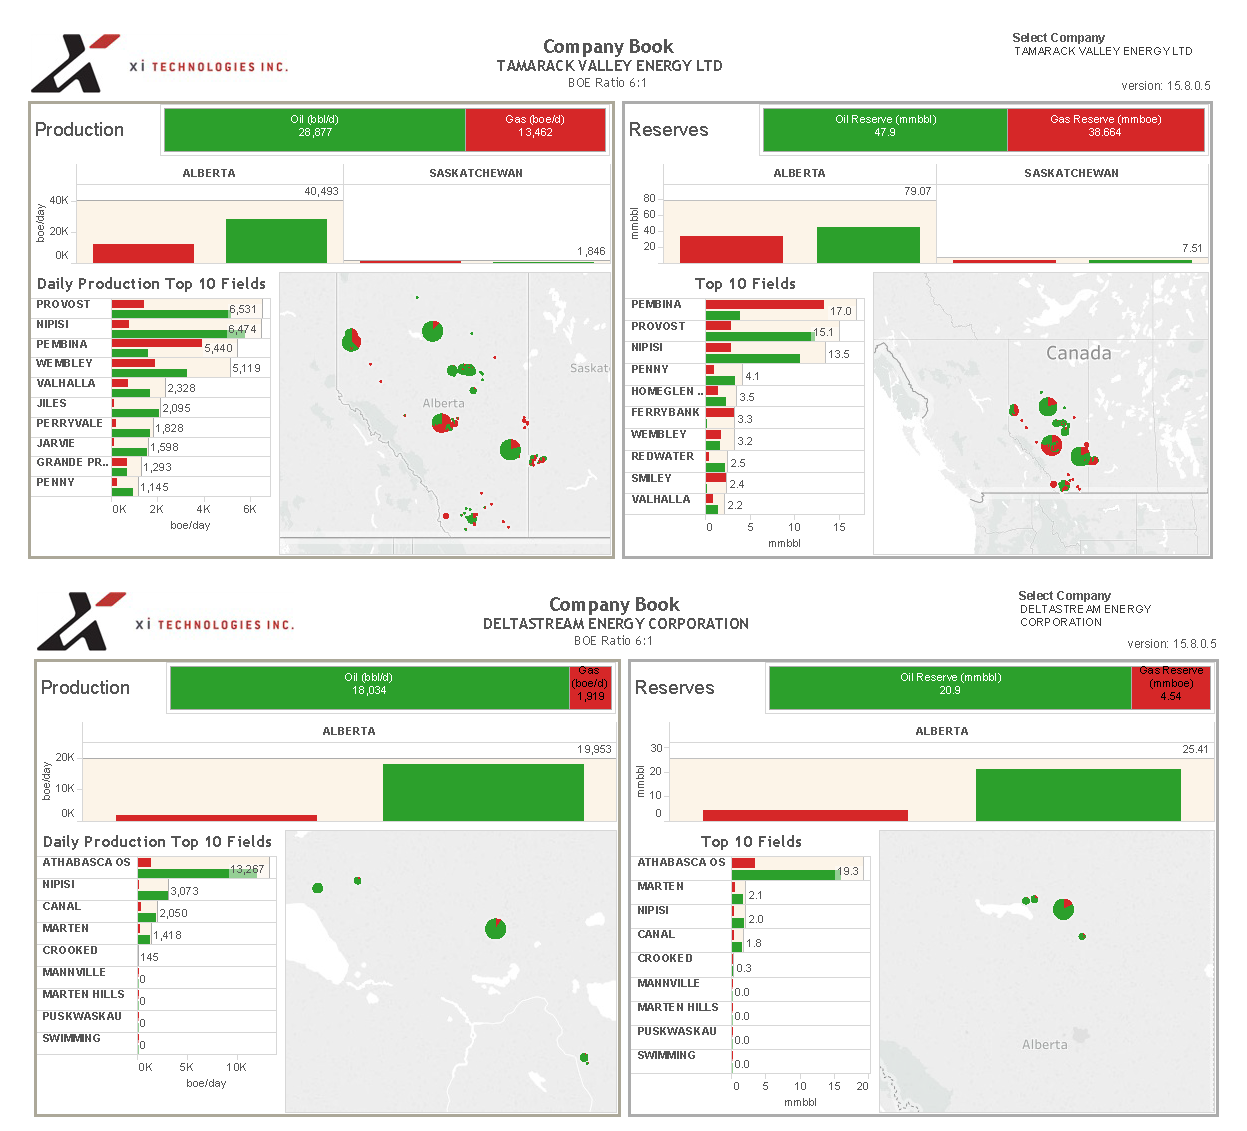
Click here to download a pdf report of the above data, including additional Land and History data.
Core Areas
This Tamarack Valley acquisition was described as an expansion of holdings in Clearwater, priming the company to grow. The acquisition follows three other high-profile corporate roll-ups, including Crestwynd Exploration (Clearwater), Anegada Oil Corp (Charlie Lake), and most recently Rolling Hills Energy (which we covered here). Mapping Deltastream’s core assets with Tamarack’s core Clearwater assets, the consolidation shows that it is an extension of assets, not an area with significant synergy between the two but is adjacent to Tamarack’s Nipisi area.
Of particular interest is the Tamarack press release on the upside potential of these assets. Looking at the Deltastream/Tamarack map you can see the considerable land holdings in this area that Tamarack will be acquiring.
Other notable companies in Deltastream’s core include Spur Petroleum (88% of Spur’s production is in this area), Headwater Exploration Inc (100% of Headwater is in this area), and Canadian Natural Resources Ltd.
ESG summary
Liabilities
According to XI’s new LCA report, Deltastream has seen year-over-year growth in BOE. Deltastream also has a very low inactive well percent, so no immediate suspend and abandon requirements and no wells that are considered marginal (<10 BOE/day), indicating this is a good growth opportunity with few short-term liabilities and good operational efficiency.
Click here to download an LCA report for the area
Using the XI ARO cost model we see that these assets are predominantly under 5 years of age and active. XI’s ARO cost model value of these assets does diverge from the Government LLR model on these assets when it comes to reclamation and remediation so comparing the two models is valuable to estimate a more comprehensive picture of the ultimate liabilities.

Emissions
Looking at the acquisition from an emissions standpoint, operational synergies should provide significant reductions in overall GHG intensity and increase gas conservation of the newly acquired assets. Tamarack Valley recently completed phase 2 (announced in Q1) of their Nipisi Gas Conservation Project, which had an immediate impact on decreasing absolute emissions. The adjacent Deltastream assets, which have lower XI-calculated gas conservation rates (~60%) and higher emissions intensity (in the ~0.04 range), should stand to benefit from the existing and future gas conservation efforts by Tamarack in the area.
Tamarack Valley has a proven track record of innovative strategies to mitigate higher emissions, and mentions in their press release that this acquisition will continue their “focus on environment, indigenous partnerships and ethical governance that includes sustainability-linked lending, emission reductions, proactive asset decommissioning, stakeholder engagement and indigenous partnership”.
If you’d like to learn more about how XI’s AssetSuite software can analyze potential mergers and acquisitions, including examining potential liabilities and emissions, contact XI Technologies.
Each week, XI Technologies scans its unique combination of enhanced industry data to provide trends and insights that have value for professionals doing business in the WCSB. If you’d like to receive our Wednesday Word to the Wise in your inbox, subscribe here.
15 Weeks ago, we left our offices for the weekend, not knowing that we wouldn’t be coming back for the unforeseen future. People were thrust into having to work in their home offices/dining rooms/wherever they could plug in a laptop and try to figure out how to perform the tasks usually done on company computers (and their dual monitors) while missing having colleagues around the corner to collaborate with.
As with most companies in the oil and gas industry, this was and is the case for XI Technologies. While we had prepared for the possibility of remote work as news of the pandemic reaching North America began to spread, we still found ourselves in unfamiliar territory Monday, March 16th. Our top priority at that moment was ensuring as much continuity of customer service as possible and have learned some best practices through this experience we’d like to share with the industry.
1. Ensure support personnel have the infrastructure they need
Before you can provide clients with the support they need to work remotely, you first need to ensure that your support personnel have what they need. As a web-based software company, our support team was already positioned to access the main tools required to work from wherever they needed. In addition to this, our IT department ensured they had access to additional hardware options as required: webcam-enabled laptops, additional monitors, and other accessories. As the time of self-isolating progressed, we upgraded our VPN to accommodate the increased demand of an entire workforce needing to remotely connect to local servers.
Is your support team equipped to provide client services when they’re out of the office? To accomplish this, you may need extra hardware available either permanently issued to them or to issue as required. You’ll need support software to either be web-based, accessible by terminal servers, or installed into computers they can access at home (either their own or company-issued). And you’ll need an IT team able to provide your supporters with remote support as required.
2. Be prepared to support customers on multiple platforms
Virtual support using video conferencing apps has been an incredibly effective way of connecting with clients throughout this pandemic. But as this has moved from a tool in our toolbox to the primary method of communication, it became clear that we needed to be ready to use the platform of our client’s choice, not ours.
There are various barriers that can prevent a customer from using a particular video conferencing app, be it Zoom, Microsoft Teams, Skype, etc. Some companies have security policies that prevent the use of certain platforms (even after holes were patched). Some users work from company-issued hardware (or remote into the same) that prevent installing any new software and aren’t currently able to get access from their IT department. So, while it might be preferable for a company to adopt one standard for their video conferencing, it does limit the ability to service clients.
Our model is to ask the client which platform they’d like to use and ensure that our support team is able to provide support using it. For training, what used to be in-person classes have become virtual classrooms, broadcast simultaneously over Zoom and Teams. This flexibility extends to text-based communication, as some clients prefer to work using the chat function embedded in our software, while others prefer using email. The lesson is to be prepared to give your clients the remote support they need, not the remote support you prefer.
3. Keep it brief
Removed from the structure of their office, your clients might have multiple demands for their attention while working from home. From IMs from colleagues and clients, to demanding kids or pets, to their own TVs, fridges or beds, there’s always something pulling at them for their time. It doesn’t help that it seems like every company’s response to being forced online was to offer webinars or virtual happy hours. “Zoom fatigue” is becoming a documented phenomenon of the moment, leaving people exhausted from the disruption in routine and the demand to be virtually “on” throughout the workday.
To combat this, keeping virtual training sessions short is key. For virtual support, ask yourself if a chat needs to be video-based, or would a screenshare suffice? The goal is to provide your client with the right balance of help and personal connection while respecting their time and the unique demands now placed on it.
4. Reach out to your power users
At the start of the quarantine, we had an uptick in support tickets as users had to acclimate themselves to using our products removed from their usual processes. Even though nothing in our products had changed, as they were always web-based for remote access, how our clients used them and integrated them with other programs had. Their own workflows were interrupted, and they looked to us to help find new ones.
This led us to reach out to other power users who hadn’t contacted us to see if they needed assistance with things they didn’t even know we could help with. Forced remote work has been a difficult adjustment for many, so checking in on users to make sure their services can continue uninterrupted will both ensure continued usage and give you valuable information for changes you may need to make in your processes to meet their new demands.
While it looks like the time of forced remote working due to COVID-19 may be nearing an end, it would be careless to not prepare for another possible period of isolation should events take an undesired turn. Moreover, as the pandemic has forced employees out of offices, more companies have realized the upsides to virtual office options, be it a permanent change or merely an option as required. At the very least, for the foreseeable future, any employee exhibiting any symptoms of illness will need to work from home until symptoms cease, which will keep the demand for virtual support solutions front of mind.
To meet that demand, you need to:
- Assess if your client team has the tools they need to provide remote support.
- Be prepared to give support in a variety of platforms.
- Find solutions that can break through the many demands of the remote worker.
- Ensure your most important clients are supported, whether they reach out or not.
If you’d like more information on how XI’s cloud-based tools can help your company with its critical research in A&D, drilling, and regulatory reporting, contact our sales team
This week, XI’s Vice-President of Business Development, Jennifer Baerg, wanted to share her thoughts on the current situation in our industry.
Each week, XI Technologies scans its unique combination of enhanced industry data to provide trends and insights that have value for professionals doing business in the WCSB. If you’d like to receive our Wednesday Word to the Wise in your inbox, subscribe here.
This is our 68th weekly “Wednesday Word to the Wise” and for the first time since we embarked on this initiative in late 2018, we considered not submitting an article. We tossed around a wide variety of topics such as evaluating properties that are currently for sale, a look at the OWA and the recent federal stimulus, or offering webinars to those who want to use this time to brush up on their skills, but ultimately didn’t land on any of those. We endeavor to write things that are topical, accurate, and finds the right balance between providing useful information and displaying our capabilities without being overly promotional.
This week was different for us. With the unprecedented global recession due to COVID-19 and now with oil prices plunging to negative for the first time, we understood that people were just trying to get their heads around their situations, and our topics could be back of mind for good reason.
We are now into our sixth week of working remotely with no concrete idea about when we might get back to “normal”. It is easy to feel a sense of hopelessness as we watch the news and see the horrific loss of human life, the destruction of our companies, our industry, and our economy. We’ve all gone through the emotional roller coaster of feeling the sense of loss, rallying to stay positive, fearing the unknown, enjoying small successes, anger over what could have been prevented, the quest to find positive silver linings… the list goes on and on.
We are all in the same boat hoping that we are making the right decisions and finding opportunities amidst the disruption. We are used to innovating – that is our spirit and reputation here in the West. At XI, we have brainstormed ways that we can help our clients, the industry we serve, and our business community as a whole. We’ve tried to focus on the positive things we’ve seen such as greater communication with our clients, streamlining our business and workflows, and opportunities for new and exciting emerging trends. We continue to be optimistic that, like other industry downturns we’ve seen in our 25+ years, we will survive this one too.
So although this article will not have any fancy graphs or insightful information, it does have a heartfelt message to all of you. We are here. We want to help. We want to survive this together. I think of all the innovation we have had at XI over the years and how much of it has been inspired by collaboration with clients and industry contacts. I can’t help but think that this will be an enormous uphill climb but also a time to come together (virtually, for now) and re-think how our industry must evolve. Reach out to us if you have ideas, suggestions, or simply just want to connect.
Take care of yourselves and we look forward to having a coffee with you soon.
Yours Sincerely,
Jennifer Baerg & the XI Team
