Word to the Wise: Could we have seen the 2014 downturn coming?
April 16, 2019
In this weeks’ Wednesday Word to the Wise, we examine land sales and bonuses paid as an indicator of future industry strength.
Each week, XI Technologies scans its unique combination of enhanced industry data to provide trends and insights that have value for professionals doing business in the WCSB. If you’d like Wednesday Word to the Wise delivered directly to your inbox, subscribe here.
Last week, XI’s Word to the Wise article looked at how much our industry has consolidated since the downturn began in late 2014. This week’s article was to be a “Part 2” of that, focusing on the change in the volume of Crown land sales across Saskatchewan, Alberta, and B.C., and the value of bonuses paid over the same 2014 to 2018 period. While querying XI’s enhanced AssetBook database, we decided to look all the way back to 2011. And we were a bit surprised by what we saw.
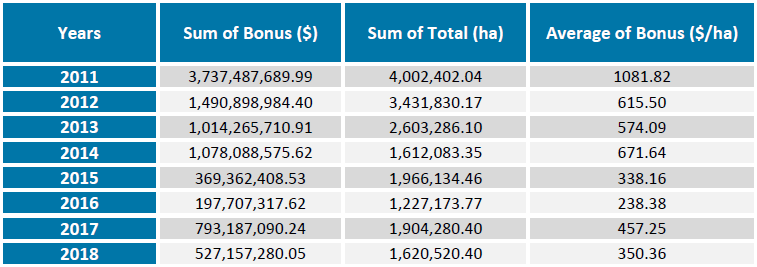
Crown land sales are, in many ways, a barometer for the industry’s confidence in current market conditions as well as an indicator of the amount of industry activity one might expect in future years. What surprised us in our data review was that after strong WCSB Crown land sales in 2011, there was a significant drop-off of activity and bonus values in 2012. And that activity has never recovered since.
As shown in Figure 1 below, Crown land sales in 2011 yielded total bonuses of $3,737,487,689.99 on a total of 4,002,402.04 hectares. The average bonus paid on lands in 2011 was $1,081.82/hectare. The following year, total bonus dollars plummeted by over 60 percent to $1,490,898,984.40 based on 3,431,830.17 total hectares and an average bonus of $615.50/hectare.
This apparent drop-off in land sale activity – and presumably in industry expansion confidence – piqued our interest and we began to look for other factors that might have been at play. We looked to the Deloitte Canadian oil and gas price forecasts from early 2012 for indicators. At the time, Deloitte’s (formerly AJM Deloitte) forecast commentary for March 31, 2012 stated: “The North American market is feeling the full effects of the continued oversupply of natural gas as a result of a very mild winter experienced on both sides of the border.” “Even with the decline in natural gas drilling,” Deloitte noted, “there appears to be no drop in supply.” Deloitte’s June 30, 2012 commentary also notes that with “technologies to access tight natural gas through horizontal drilling and multi-fracturing…created an oversupply in the North American market, driving down natural gas prices to levels not seen in decades.” As a gas-rich basin, Canada’s industry would be hardest hit, and pipeline access to more lucrative foreign markets was essential before a recovery could be seen.
On the oil side, Deloitte’s forecast commentary of June 30, 2012, also offered caution. The same technological advancements were opening up access to additional production of tight oil, and Canadian oilsands expansion was increasing oil production during a time when demand was stagnating.
“Adding insult to injury is the commodity pricing,” Deloitte’s forecaster remarked in June 2012. “Over the past year to 18 months, there has been a disconnect between the benchmark price of West Texas Intermediate (WTI) and that of international reference crudes like the United Kingdom’s Brent. There have been many instances where the premium to Brent from WTI has exceeded over $15.00/bbl. The low natural gas price and the premium of international oil prices are driving North American companies to review the pipeline infrastructure. This begs the question of how do they get their products to these higher-priced markets?”
Of course, at that time, no one could have predicted that OPEC countries would drastically boost production and drive down international oil prices, triggering the major industry downturn that began in 2014-15. But looking back at historical Alberta land sale figures brings an eerie focus to a problem that had existed since long before 2014.
Of course, hindsight is 20/20. It’s easy to spot an issue after it’s already occurred and there is nothing any of us can do to change the course of past events. But arming ourselves with information may help us to understand how we got where we are, how we can recognize old patterns, and how we can adjust course to avoid repeating history. That’s where AssetBook data is invaluable.
Many of the Crown lands referenced in this article were never drilled and have been turned back to the government. If you would like a breakdown of land holdings by specific area(s) of interest contact XI for a demo of the AssetBook or learn more about Assetbook here.
